View State Profile
Change District:
Schools
Bluff School
Claremont Middle School
Claremont Preschool Center
Disnard Elementary School
Maple Avenue School
Stevens High School
Career and Technical Education Centers
Sugar River Valley RTC - Claremont
|
District:Claremont
|
View: State Profile
Home |
Compare |
Glossary
Select a School Year:
|
|
|
| General Information |
 |
District: Claremont
(101)
|
SAU: Claremont SAU Office (6) |
| Address: 165 Broad St., Claremont, NH 03743-2624 |
Telephone: 603-543-4200 |
| NCES District ID: 3302340 |
Fax: |
| Interim Superintendent: Christopher Pratt |
Web Site: |
| |
| District Report Card 2016-17 |
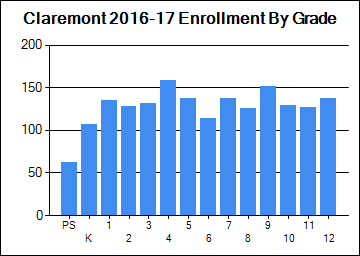
| Enrollment |
| | October 1 Enrollment | Average Class Size |
| Grade(s) | District | State | District | State |
| PreSchool | 62 | 3,894 | | |
| Kindergarten | 107 | 11,422 | | |
| Readiness | 0 | 65 | | |
| Grade 1 | 135 | 12,378 | 17 | 17 |
| Grade 2 | 128 | 12,885 | 16 | 18 |
| Grade 3 | 131 | 13,309 | 15 | 19 |
| Grade 4 | 159 | 13,612 | 20 | 19 |
| Grade 5 | 137 | 13,718 | 23 | 20 |
| Grade 6 | 114 | 13,722 | 0 | 20 |
| Grade 7 | 137 | 14,102 | 0 | 21 |
| Grade 8 | 126 | 14,075 | 0 | 21 |
| Grade 9 | 152 | 15,139 | | |
| Grade 10 | 129 | 14,292 | | |
| Grade 11 | 127 | 13,785 | | |
| Grade 12 | 138 | 13,338 | | |
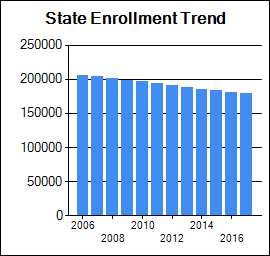
| Total Enrollment | 1782 | 179,737 | | |
|
|
| School Safety |
| | District | State |
| School Safety Incidences | 24 | 1,073 |
| Total Number of Incidents | 395 | 6,825 |
| No. of Incidents/1,000 students | 222 | 38 |
|
| Attendance/Four-Year Graduation Rate |
| | District | State |
| PreSchool Attendance Rate | 92.3 | 89.8 |
| Elem/Middle Attendance Rate (Target: 90%) | 94.7 | 95.1 |
| High School Four-Year Graduation Rate (Target: 90%) | 78 | 89 |
[More Details]
|
|
|
|
| School Staff |
| | District | State |
| Teachers | 161 | 14,758 |
| Instructional Support | 95 | 6,980 |
| Librarians | 3 | 324 |
| Specialists | 28 | 2,772 |
| Admin Support | 13 | 1,247 |
| All Other Support | 28 | 3,241 |
[More Details]
|
|
| State and Federal Accountability |
|
|
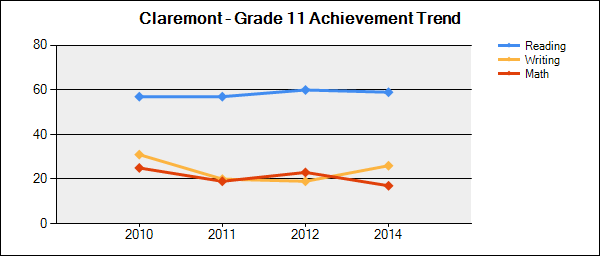
Student Achievement Trends
N is the number of students participating.
% is the percent of students scoring proficient or above.
Click on a grade to show the achievement trend for that grade.
Note: Grade 11 results are from the new SAT assessment tests and not comparable to 2014-2015 |
 |
| Grade | Content Area | 2015-2016 | 2016-2017 |
| N | % | N | % |
| 3 | Reading |
142 | 35 | 118 | 45 | | Mathematics |
142 | 44 | 120 | 42 | | 4 | Reading |
132 | 41 | 151 | 43 | | Mathematics |
132 | 40 | 151 | 44 | | 5 | Reading |
116 | 43 | 123 | 46 | | Mathematics |
116 | 22 | 124 | 29 | | 6 | Reading |
127 | 39 | 108 | 28 | | Mathematics |
126 | 33 | 105 | 28 | | 7 | Reading |
112 | 39 | 128 | 34 | | Mathematics |
112 | 34 | 131 | 33 | | 8 | Reading |
121 | 40 | 113 | 40 | | Mathematics |
122 | 34 | 117 | 34 | | 11 | Reading |
105 | 59 | 106 | 38 | | Mathematics |
105 | 27 | 106 | 26 |
|
|
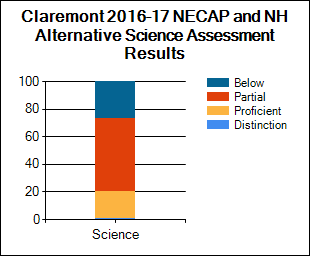
| NECAP and NH Alternative Assessment Science Results 2016-17 |
Student Assessment
* indicates total number of test takers is 10 or less.
Blank indicates no science assessment test administered.
|
| Achievement Level (%) | Science |
| District | State |
| Substantially Below Proficient (%) |
27
| 18 |
| Partially Proficient (%) |
53
| 46 |
| Proficient (%) |
19
| 35 |
| Proficient with Distinction (%) |
1
| 2 |
| Longitudinal Reports and Subgroup Reporting |
| Percent of students at each achievement level |
Math |
Reading |
Science |
|
|
|
| National Assessment of Educational Progress (NAEP) Student Achievement Data-Percent of NH Students At or Above Each Achievement Level (Based on the Winter 2015 NAEP Assessment) |
| NAEP achievement levels are indicated as follows: B+ for Basic or above, P+ for Proficient or above, and A for Advanced |
| Reading |
| Grade | B+ | P+ | A |
| 4 | 79 | 46 | 12 |
| 8 | 85 | 45 | 5 |
| Math |
| Grade | B+ | P+ | A |
| 4 | 91 | 51 | 10 |
| 8 | 84 | 46 | 12 |
|
|
|
|
|
New Hampshire Department of Education
101 Pleasant Street | Concord, NH | 03301-3494
Telephone: (603) 271-3494 | TDD Access: Relay NH 711
|
