View State Profile
Return to North Country Charter Academy District
Schools
North Country Charter Academy (H)
North Country Charter Academy (M)
|
School:North Country Charter Academy (M)
|
View: State Profile
Home |
Compare |
Glossary
Select a School Year:
|
|
|
| General Information |
 |
School: North Country Charter Academy (M) (28505) |
NCES School ID: 00613 |
| District: North Country Charter Academy (703) |
NCES District ID: 3300030 |
| SAU: North Country Charter Academy (402) |
School Web Site: www.northcountrycharteracademy.com |
| Admin Principal: Lisa Lavoie |
SAU Telephone: 603-444-1535 |
| Admin Principal: Lisa Lavoie |
School Telephone: 603-444-1535 |
| Address: 260 Cottage St., Suite A, Littleton, NH 03561-4137 |
School Fax: 603-444-9843 |
| School Open Date:
7/1/2004 | School Close Date:
|
| School Type: Charter Schools approved by the state |
Grades Offered: 7-8 |
| Federal Accountability Status:
None Assigned |
NH Adequacy Status Met: N/A |
| School Report Card 2013-14 |
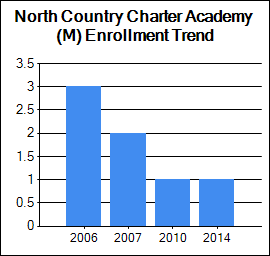
| Enrollment |
| | October 1 Enrollment | Average Class Size |
| Grade(s) | School | District | State | School | District | State |
| PreSchool | 0 | 0 | 3,401 | | | |
| Kindergarten | 0 | 0 | 11,602 | | | |
| Readiness | 0 | 0 | 58 | | | |
| Grade 1 | 0 | 0 | 13,461 | 0 | 0 | 18 |
| Grade 2 | 0 | 0 | 13,510 | 0 | 0 | 18 |
| Grade 3 | 0 | 0 | 13,546 | 0 | 0 | 19 |
| Grade 4 | 0 | 0 | 13,925 | 0 | 0 | 20 |
| Grade 5 | 0 | 0 | 13,920 | 0 | 0 | 20 |
| Grade 6 | 0 | 0 | 14,224 | 0 | 0 | 21 |
| Grade 7 | 0 | 0 | 14,328 | 0 | 0 | 22 |
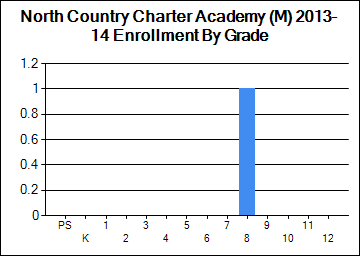
| Grade 8 | 1 | 1 | 14,612 | 1 | 0 | 22 |
| Grade 9 | 0 | 0 | 15,646 | | | |
| Grade 10 | 0 | 5 | 14,953 | | | |
| Grade 11 | 0 | 13 | 14,159 | | | |
| Grade 12 | 0 | 28 | 13,962 | | | |
| Total Enrollment | 1 | 47 | 185,320 | | | |
|
|
| School Safety |
| | School | District | State |
| School Safety Incidences | 0 | 0 | 775 |
| Total Number of Incidents | 0 | 0 | 7,209 |
| No. of Incidents/1,000 students | 0 | 0 | 39 |
[View Safety Survey]
|
| Attendance/Four-Year Graduation Rate |
| | School | District | State |
| PreSchool Attendance Rate | | | 92.6 |
| Elem/Middle Attendance Rate (Target: 90%) | 100 | 100 | 95.5 |
| High School Four-Year Graduation Rate (Target: 90%) | | 73.8 | 88.7 |
[More Details]
|
|
| Teacher Quality |
| | School | District | State |
| N | % | N | % | N | % |
| Core Classes Taught by non-HQT | N/C | N/C | N/C | | 2275 | 4.3 |
| Core Classes Taught by non-HQT in High-Poverty Schools | | N/A | | N/A | | 0.9 |
| Core Classes Taught by non-HQT in Low-Poverty Schools | | N/A | | N/A | | 1.4 |
| Employed Under Emergency Credentials | N/A | N/A | N/A | N/A | 1 | 0.01 |
| Bachelor's Degree | | N/C | | 50.0 | | 42.2 |
| Master's Degree | | N/C | | 50.0 | | 56.5 |
| Degree beyond Master's Degree | | N/C | | 0.0 | | 1.0 |
[More Details]
|
|
| School Staff |
| | School | District | State |
| Teachers | 0 | 4 | 14,826 |
| Instructional Support | 0 | 0 | 6,999 |
| Librarians | 0 | 0 | 312 |
| Specialists | 0 | 2 | 2,551 |
| Admin Support | 0 | 1 | 1,248 |
| All Other Support | 0 | 1 | 3,627 |
[More Details]
|
|
| State and Federal Accountability |
|
|
Student Assessment
* indicates total number of test takers is 10 or less.
Blank indicates no science assessment test administered.
|
| Achievement Level (%) | Reading | Mathematics | Writing | Science |
| School | District | State | School | District | State | School | District | State | School | District | State |
| Substantially Below Proficient (%) | | 11 | 7 | | 58 | 17 | | 5 | 8 | 100 | 54 | 18 |
| Partially Proficient (%) | | 37 | 16 | | 11 | 18 | | 74 | 34 | 0 | 46 | 48 |
| Proficient (%) | | 37 | 53 | | 16 | 43 | | 5 | 47 | 0 | 0 | 32 |
| Proficient with Distinction (%) | | 0 | 23 | | 0 | 21 | | 0 | 9 | 0 | 0 | 1 |
| Testing Participation (%) | | 84 | 99 | | 84 | 99 | | 84 | 98 | | 100 | 99 |
| NECAP Longitudinal Reports |
| 1) NECAP Teaching Year District Tested at Grade Comparison |
Reading and Math |
| 2) NECAP Teaching Year District "Cohort" History Comparison |
Reading and Math |
| 3) NECAP Teaching Year District vs. State by Tested at Grade |
Math |
Reading |
| |
| 4) NECAP Teaching Year District vs. State by "Cohort" History |
Math |
Reading |
| |
| 5) NECAP Teaching Year District GAP Analysis by Tested at Grade |
Math |
Reading |
| |
| 6) NECAP and NH ALPs Teaching Year Average Index Score and GAP analysis |
Math |
Reading |
Science |
Writing |
| 7) NECAP and NH ALPs Teaching Year Percent of students at each index level |
Math |
Reading |
Science |
Writing |
| 8) NECAP and NH ALPs Teaching Year Median Student Growth Percentile (SGP) and GAP analysis |
Math |
Reading |
| |
| 9) NECAP and NH ALPs Teaching Year Percent of students at each Student Growth Percentile (SGP) Grouping |
Math |
Reading |
| |
|
|
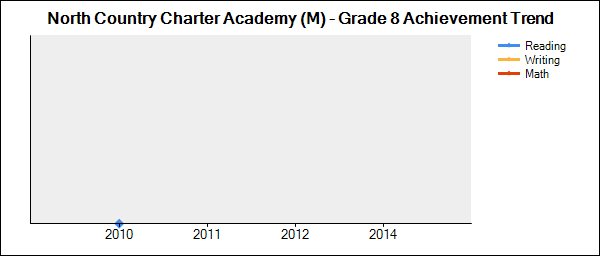
Student Achievement Trends
N is the number of students participating.
% is the percent of students scoring proficient or above.
Click on a grade to show the achievement trend for that grade. |
 |
| Grade | Content Area | 2009-2010 | 2010-2011 | 2011-2012 | 2012-2013 | 2013-2014 |
| N | % | N | % | N | % | N | % | N | % |
| 8 | Reading | 1 | 0 | | | | | | | | |
| Mathematics | 1 | | | | | | | | | |
| Writing | 0 | | | | | | | | | |
|
|
| National Assessment of Educational Progress (NAEP) Student Achievement Data-Percent of NH Students At or Above Each Achievement Level (Based on the Winter 2013 NAEP Assessment) |
| NAEP achievement levels are indicated as follows: B+ for Basic or above, P+ for Proficient or above, and A for Advanced |
| Reading |
| Grade | B+ | P+ | A |
| 4 | 80 | 45 | 11 |
| 8 | 84 | 44 | 6 |
| Math |
| Grade | B+ | P+ | A |
| 4 | 93 | 59 | 12 |
| 8 | 84 | 47 | 13 |
|
|
|
|
|

