View State Profile
Change District:
Schools
Derry Early Education Program
Derry Village School
East Derry Memorial Elementary School
Ernest P. Barka Elementary School
Gilbert H. Hood Middle School
Grinnell School
South Range Elementary School
West Running Brook Middle School
|
District:Derry Cooperative
|
View: State Profile
Home |
Compare |
Glossary
Select a School Year:
|
|
|
| General Information |
 |
District: Derry Cooperative
(131)
|
SAU: Derry Cooperative SAU Office (10) |
| Address: 18 South Main St., Derry, NH 03038-2197 |
Telephone: 603-432-1210 |
| NCES District ID: 3302610 |
Fax: |
| Superintendent: Austin Garofalo |
Web Site: |
| Federal Accountability Status Met:
No |
|
| District Report Card 2011-12 |
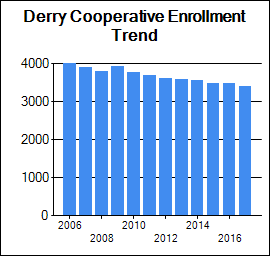
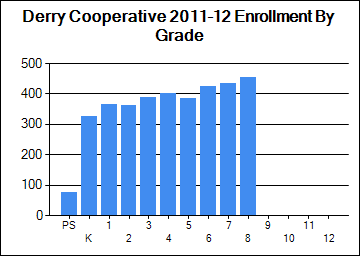
| Enrollment |
| | October 1 Enrollment | Average Class Size |
| Grade(s) | District | State | District | State |
| PreSchool | 75 | 3,165 | | |
| Kindergarten | 325 | 11,904 | | |
| Readiness | 0 | 78 | | |
| Grade 1 | 366 | 13,595 | 17 | 18 |
| Grade 2 | 360 | 13,845 | 17 | 18 |
| Grade 3 | 389 | 13,876 | 23 | 19 |
| Grade 4 | 400 | 14,167 | 20 | 20 |
| Grade 5 | 383 | 14,200 | 21 | 20 |
| Grade 6 | 425 | 14,568 | 0 | 21 |
| Grade 7 | 433 | 14,811 | 0 | 21 |
| Grade 8 | 454 | 15,102 | 0 | 22 |
| Grade 9 | 0 | 16,465 | | |
| Grade 10 | 0 | 15,350 | | |
| Grade 11 | 0 | 14,985 | | |
| Grade 12 | 0 | 14,673 | | |
| Total Enrollment | 3610 | 190,805 | | |
|
|
| School Safety |
| | District | State |
| School Safety Incidences | 11 | 1,505 |
| Total Number of Incidents | 225 | 23,633 |
| No. of Incidents/1,000 students | 62 | 124 |
|
| Attendance/Four-Year Graduation Rate |
| | District | State |
| PreSchool Attendance Rate | 91.2 | 92 |
| Elem/Middle Attendance Rate (Target: 90%) | 95.6 | 95.5 |
| High School Four-Year Graduation Rate (Target: 85%) | | 86.6 |
[More Details]
|
|
| Teacher Quality |
| | District | State |
| N | % | N | % |
| Core Classes Taught by non-HQT | 15 | 1.7 | 3276 | 5.9 |
| Core Classes Taught by non-HQT in High-Poverty Schools | | N/A | | 1.2 |
| Core Classes Taught by non-HQT in Low-Poverty Schools | | 0.0 | | 1.5 |
| Employed Under Emergency Credentials | N/A | N/A | 5 | 0.04 |
| Bachelor's Degree | | 31.9 | | 39.5 |
| Master's Degree | | 63.7 | | 47.7 |
| Degree beyond Master's Degree | | 0.0 | | 0.8 |
[More Details]
|
|
| School Staff |
| | District | State |
| Teachers | 267 | 15,049 |
| Instructional Support | 131 | 6,964 |
| Librarians | 3 | 313 |
| Specialists | 42 | 2,550 |
| Admin Support | 18 | 1,245 |
| All Other Support | 66 | 3,598 |
[More Details]
|
|
| Improvement Status |
| Status for 2011-2012 School Year | Content Area | Met AYP Requirements | Status for 2012-2013 School Year |
| DINI Year2 | Reading | No | Corrective Action/Level 3 |
| Restructuring/Level 5 | Math | No | Restructuring/Level 6 |
| Acceptable | Other | Yes | Acceptable |
| Statewide NCLB Accountability Status |
| | READING | MATHEMATICS |
| Schools | Districts | Schools | Districts |
| N | % | N | % | N | % | N | % |
| Acceptable | 279 | 60.5 | 105 | 65.6 | 241 | 52.3 | 82 | 51.6 |
| SINI/DINI Year 1 | 41 | 8.9 | 24 | 15.0 | 67 | 14.5 | 26 | 16.4 |
| SINI/DINI Year2 | 57 | 12.4 | 13 | 8.1 | 71 | 15.4 | 26 | 16.4 |
| Corrective Action/Level 3 | 37 | 8.0 | 13 | 8.1 | 34 | 7.4 | 11 | 6.9 |
| Restructure Planning/Level 4 | 23 | 5.0 | 3 | 1.9 | 27 | 5.9 | 9 | 5.7 |
| Restructuring/Level 5&6 | 24 | 5.2 | 2 | 1.3 | 21 | 4.6 | 5 | 3.1 |
| State Total | 461 | 100.0 | 160 | 100.0 | 461 | 100 | 159 | 100.0 |
|
|
| Assessment Rankings |
| Ranking School Type | Subject | Nbr. of Students | Index Score and Std Error | Index Score Ranking | No. of Students Prior Year | Prior Year Index Score and Std Error | Index Score Improvement | Index Score Improvement Ranking |
|
Elem/Middle | Math | 2358 | 89.1 (+/-0.4) | 82 of 156 | 2443 | 89.5 (+/-0.4) | -0.4 | 100 of 155 | |
Elem/Middle | Read | 2359 | 91.8 (+/-0.4) | 108 of 156 | 2442 | 92 (+/-0.3) | -0.2 | 101 of 155 | |
Elem/Middle | Write | 796 | 86.2 (+/-0.7) | 84 of 143 | 846 | 86.6 (+/-0.7) | -0.4 | 60 of 140 | |
High School | Math | 6 | - | - | 1 | - | - | - | |
High School | Read | 6 | - | - | 1 | - | - | - | |
High School | Write | - | - | - | - | - | - | - |
|
|
Student Assessment
* indicates total number of test takers is 10 or less.
Blank indicates no science assessment test administered.
|
| Achievement Level (%) | Reading | Mathematics | Writing | Science |
| District | State | District | State | District | State | District | State |
| Substantially Below Proficient (%) | 6 | 7 | 11 | 16 | 7 | 8 | 11 | 17 |
| Partially Proficient (%) | 17 | 15 | 16 | 17 | 36 | 37 | 47 | 43 |
| Proficient (%) | 56 | 54 | 47 | 43 | 48 | 45 | 40 | 37 |
| Proficient with Distinction (%) | 21 | 24 | 26 | 23 | 8 | 8 | 1 | 1 |
| Testing Participation (%) | 100 | 99 | 100 | 99 | 98 | 99 | 99 | 99 |
| For assessment rankings click on this link: | [Ranking Reports] |
| NECAP Longitudinal Reports |
| 1) NECAP Teaching Year District Tested at Grade Comparison |
Reading and Math |
| 2) NECAP Teaching Year District "Cohort" History Comparison |
Reading and Math |
| 3) NECAP Teaching Year District vs. State by Tested at Grade |
Math |
Reading |
| |
| 4) NECAP Teaching Year District vs. State by "Cohort" History |
Math |
Reading |
| |
| 5) NECAP Teaching Year District GAP Analysis by Tested at Grade |
Math |
Reading |
| |
| 6) NECAP and NH ALPs Teaching Year Average Index Score and GAP analysis |
Math |
Reading |
Science |
Writing |
| 7) NECAP and NH ALPs Teaching Year Percent of students at each index level |
Math |
Reading |
Science |
Writing |
| 8) NECAP and NH ALPs Teaching Year Median Student Growth Percentile (SGP) and GAP analysis |
Math |
Reading |
| |
| 9) NECAP and NH ALPs Teaching Year Percent of students at each Student Growth Percentile (SGP) Grouping |
Math |
Reading |
| |
|
|
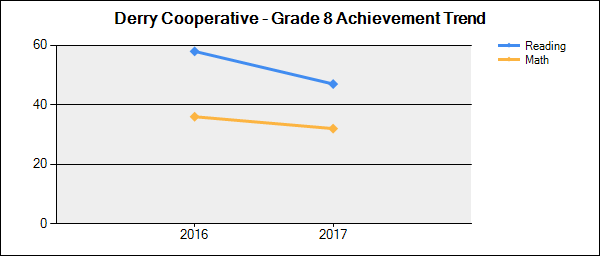
Student Achievement Trends
N is the number of students participating.
% is the percent of students scoring proficient or above.
Click on a grade to show the achievement trend for that grade. |
 |
| Grade | Content Area | 2009-2010 | 2010-2011 | 2011-2012 | 2012-2013 | 2013-2014 |
| N | % | N | % | N | % | N | % | N | % |
| 3 | Reading | 395 | 80 | 398 | 80 | 392 | 72 | 376 | 75 | 363 | 72 |
| Mathematics | 395 | 78 | 399 | 80 | 392 | 74 | 376 | 71 | 363 | 66 |
| 4 | Reading | 410 | 68 | 384 | 74 | 399 | 79 | 384 | 77 | 390 | 73 |
| Mathematics | 410 | 77 | 384 | 79 | 399 | 82 | 385 | 80 | 390 | 71 |
| 5 | Reading | 428 | 85 | 417 | 75 | 386 | 76 | 413 | 80 | 390 | 77 |
| Mathematics | 429 | 80 | 417 | 74 | 387 | 79 | 414 | 79 | 390 | 73 |
| Writing | 0 | | 416 | 58 | 387 | 52 | 413 | 58 | 390 | 62 |
| 6 | Reading | 444 | 77 | 437 | 81 | 426 | 73 | 404 | 78 | 418 | 78 |
| Mathematics | 444 | 76 | 438 | 74 | 426 | 69 | 404 | 74 | 418 | 71 |
| 7 | Reading | 468 | 79 | 457 | 74 | 435 | 78 | 433 | 70 | 423 | 71 |
| Mathematics | 468 | 70 | 457 | 69 | 435 | 70 | 434 | 61 | 423 | 62 |
| 8 | Reading | 497 | 76 | 480 | 78 | 454 | 83 | 436 | 79 | 454 | 70 |
| Mathematics | 497 | 66 | 482 | 65 | 455 | 69 | 439 | 67 | 455 | 56 |
| Writing | 0 | | 480 | 59 | 454 | 59 | 436 | 67 | 455 | 57 |
|
|
| National Assessment of Educational Progress (NAEP) Student Achievement Data-Percent of NH Students At or Above Each Achievement Level (Based on the Winter 2011 NAEP Assessment) |
| NAEP achievement levels are indicated as follows: B+ for Basic or above, P+ for Proficient or above, and A for Advanced |
| Reading |
| Grade | B+ | P+ | A |
| 4 | 78 | 43 | 10 |
| 8 | 84 | 40 | 4 |
| Math |
| Grade | B+ | P+ | A |
| 4 | 92 | 57 | 11 |
| 8 | 82 | 44 | 11 |
|
|
|
|
|

