View State Profile
Change District:
Schools
Ellis School
|
District:Fremont
|
View: State Profile
Home |
Compare |
Glossary
Select a School Year:
|
|
|
| General Information |
 |
District: Fremont
(189)
|
SAU: Fremont SAU Office (83) |
| Address: 432 Main Street, Fremont, NH 03044 |
Telephone: 603-895-6903 |
| NCES District ID: 3303150 |
Fax: |
| Superintendent: Ellen Halliday |
Web Site: |
| |
| District Report Card 2014-15 |
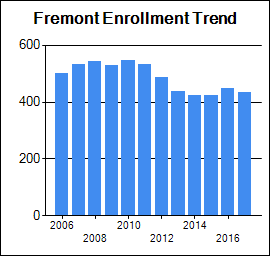
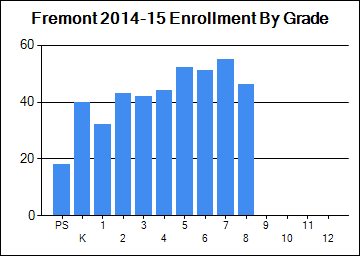
| Enrollment |
| | October 1 Enrollment | Average Class Size |
| Grade(s) | District | State | District | State |
| PreSchool | 18 | 3,557 | | |
| Kindergarten | 40 | 11,570 | | |
| Readiness | 0 | 55 | | |
| Grade 1 | 32 | 13,157 | 16 | 17 |
| Grade 2 | 43 | 13,408 | 14 | 18 |
| Grade 3 | 42 | 13,553 | 14 | 19 |
| Grade 4 | 44 | 13,558 | 15 | 19 |
| Grade 5 | 52 | 13,978 | 17 | 20 |
| Grade 6 | 51 | 13,960 | 17 | 21 |
| Grade 7 | 55 | 14,307 | 18 | 21 |
| Grade 8 | 46 | 14,343 | 15 | 22 |
| Grade 9 | 0 | 15,461 | | |
| Grade 10 | 0 | 14,746 | | |
| Grade 11 | 0 | 14,263 | | |
| Grade 12 | 0 | 13,671 | | |
| Total Enrollment | 423 | 183,604 | | |
|
|
| School Safety |
| | District | State |
| School Safety Incidences | 1 | 1,000 |
| Total Number of Incidents | 4 | 6,560 |
| No. of Incidents/1,000 students | 9 | 36 |
|
| Attendance/Four-Year Graduation Rate |
| | District | State |
| PreSchool Attendance Rate | | 95.9 |
| Elem/Middle Attendance Rate (Target: 90%) | 96 | 95.2 |
| High School Four-Year Graduation Rate (Target: 90%) | 0 | 88.1 |
[More Details]
|
|
| Teacher Quality |
| | District | State |
| N | % | N | % |
| Core Classes Taught by non-HQT | 3 | 2.5 | 3439 | 6.3 |
| Core Classes Taught by non-HQT in High-Poverty Schools | | N/A | | 0.9 |
| Core Classes Taught by non-HQT in Low-Poverty Schools | | 2.5 | | 2.1 |
| Employed Under Emergency Credentials | N/A | N/A | 2 | 0.02 |
| Bachelor's Degree | | 17.1 | | 40.9 |
| Master's Degree | | 82.9 | | 57.7 |
| Degree beyond Master's Degree | | 0.0 | | 1.1 |
[More Details]
|
|
| School Staff |
| | District | State |
| Teachers | 36 | 14,726 |
| Instructional Support | 17 | 7,007 |
| Librarians | 1 | 318 |
| Specialists | 12 | 2,713 |
| Admin Support | 3 | 1,243 |
| All Other Support | 3 | 3,535 |
[More Details]
|
|
| State and Federal Accountability |
|
|
N is the number of students participating.
% is the percent of students scoring proficient or above.
Click on a grade to show the achievement results for that grade. |
 |
| Grade | Content Area |
District |
State |
| N | % |
N | % |
| 3 | English Language Arts | 40 | 42 |
13,330 | 55 |
| Mathematics |
39 | 33 |
13,333 | 53 |
| 4 | English Language Arts | 43 | 65 |
13,195 | 56 |
| Mathematics |
43 | 33 |
13,300 | 49 |
| 5 | English Language Arts | 52 | 46 |
13,737 | 63 |
| Mathematics |
51 | 24 |
13,734 | 45 |
| 6 | English Language Arts | 50 | 42 |
13,539 | 57 |
| Mathematics |
50 | 28 |
13,581 | 46 |
| 7 | English Language Arts | 54 | 76 |
13,656 | 62 |
| Mathematics |
54 | 54 |
13,672 | 50 |
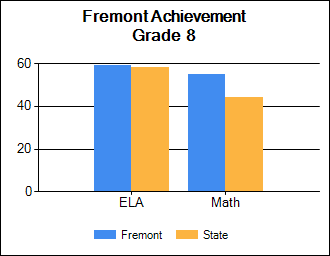
| 8 | English Language Arts | 44 | 59 |
13,487 | 58 |
| Mathematics |
44 | 55 |
13,509 | 44 |
|
|
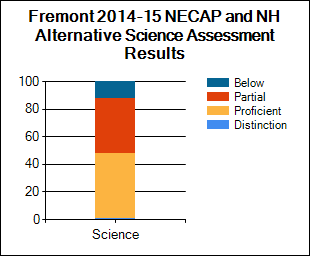
| NECAP and NH Alternative Assessment Science Results 2014-15 |
Student Assessment
* indicates total number of test takers is 10 or less.
Blank indicates no science assessment test administered.
|
| Achievement Level (%) | Science |
| District | State |
| Substantially Below Proficient (%) |
12
| 19 |
| Partially Proficient (%) |
40
| 46 |
| Proficient (%) |
47
| 34 |
| Proficient with Distinction (%) |
1
| 2 |
| Longitudinal Reports and Subgroup Reporting |
| Percent of students at each achievement level |
Math |
Reading |
Science |
|
|
|
|
| National Assessment of Educational Progress (NAEP) Student Achievement Data-Percent of NH Students At or Above Each Achievement Level (Based on the Winter 2013 NAEP Assessment) |
| NAEP achievement levels are indicated as follows: B+ for Basic or above, P+ for Proficient or above, and A for Advanced |
| Reading |
| Grade | B+ | P+ | A |
| 4 | 80 | 45 | 11 |
| 8 | 84 | 44 | 6 |
| Math |
| Grade | B+ | P+ | A |
| 4 | 93 | 59 | 12 |
| 8 | 84 | 47 | 13 |
|
|
|
|
|

