View State Profile
Change District:
Schools
Kearsarge Reg. Elem. School at New London
Kearsarge Reg. Elementary School - Bradford
Kearsarge Regional High School
Kearsarge Regional Middle School
Kearsarge Regional Preschool New London
Simonds Elementary School
Sutton Central Elementary School
|
District:Kearsarge Regional
|
View: State Profile
Home |
Compare |
Glossary
Select a School Year:
|
|
|
| General Information |
 |
District: Kearsarge Regional
(276)
|
SAU: Kearsarge Regional SAU Office (65) |
| Address: 114 Cougar Court, New London, NH 03257-4554 |
Telephone: 603-526-2051 |
| NCES District ID: 3304040 |
Fax: 603-526-2145 |
| Superintendent: Winfried Feneberg |
Web Site: |
| |
| District Report Card 2016-17 |
| Enrollment |
| | October 1 Enrollment | Average Class Size |
| Grade(s) | District | State | District | State |
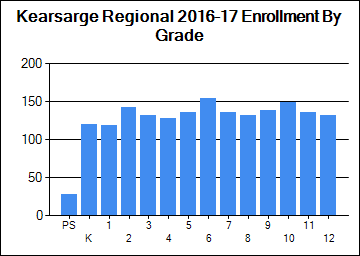
| PreSchool | 28 | 3,894 | | |
| Kindergarten | 119 | 11,422 | | |
| Readiness | 0 | 65 | | |
| Grade 1 | 118 | 12,378 | 15 | 17 |
| Grade 2 | 142 | 12,885 | 14 | 18 |
| Grade 3 | 131 | 13,309 | 19 | 19 |
| Grade 4 | 128 | 13,612 | 18 | 19 |
| Grade 5 | 136 | 13,718 | 17 | 20 |
| Grade 6 | 154 | 13,722 | 0 | 20 |
| Grade 7 | 136 | 14,102 | 0 | 21 |
| Grade 8 | 131 | 14,075 | 0 | 21 |
| Grade 9 | 138 | 15,139 | | |
| Grade 10 | 149 | 14,292 | | |
| Grade 11 | 136 | 13,785 | | |
| Grade 12 | 132 | 13,338 | | |
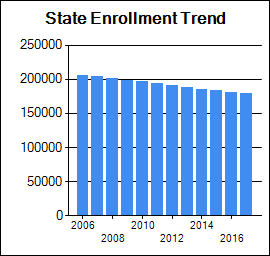
| Total Enrollment | 1778 | 179,737 | | |
|
|
| School Safety |
| | District | State |
| School Safety Incidences | 6 | 1,073 |
| Total Number of Incidents | 51 | 6,825 |
| No. of Incidents/1,000 students | 29 | 38 |
|
| Attendance/Four-Year Graduation Rate |
| | District | State |
| PreSchool Attendance Rate | 100 | 89.8 |
| Elem/Middle Attendance Rate (Target: 90%) | 95.4 | 95.1 |
| High School Four-Year Graduation Rate (Target: 90%) | 95 | 89 |
[More Details]
|
|
|
|
| School Staff |
| | District | State |
| Teachers | 161 | 14,758 |
| Instructional Support | 83 | 6,980 |
| Librarians | 4 | 324 |
| Specialists | 39 | 2,772 |
| Admin Support | 15 | 1,247 |
| All Other Support | 30 | 3,241 |
[More Details]
|
|
| State and Federal Accountability |
|
|
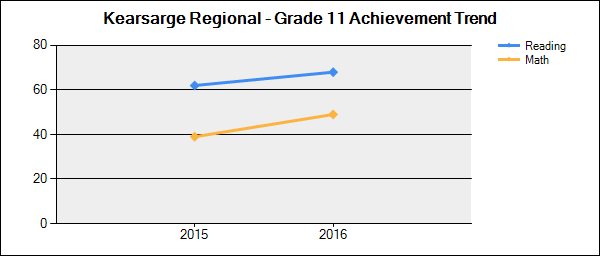
Student Achievement Trends
N is the number of students participating.
% is the percent of students scoring proficient or above.
Click on a grade to show the achievement trend for that grade.
Note: Grade 11 results are from the new SAT assessment tests and not comparable to 2014-2015 |
 |
| Grade | Content Area | 2015-2016 | 2016-2017 |
| N | % | N | % |
| 3 | Reading |
127 | 74 | 127 | 66 | | Mathematics |
127 | 80 | 127 | 61 | | 4 | Reading |
123 | 80 | 117 | 73 | | Mathematics |
123 | 74 | 118 | 63 | | 5 | Reading |
141 | 74 | 130 | 73 | | Mathematics |
141 | 55 | 130 | 54 | | 6 | Reading |
138 | 69 | 153 | 67 | | Mathematics |
139 | 54 | 152 | 45 | | 7 | Reading |
127 | 65 | 134 | 77 | | Mathematics |
127 | 51 | 134 | 65 | | 8 | Reading |
148 | 68 | 128 | 61 | | Mathematics |
148 | 45 | 128 | 39 | | 11 | Reading |
133 | 68 | 130 | 69 | | Mathematics |
133 | 49 | 130 | 44 |
|
|
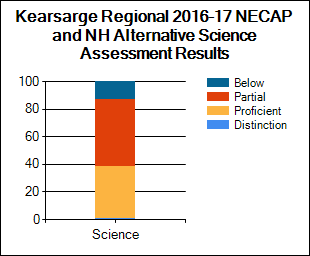
| NECAP and NH Alternative Assessment Science Results 2016-17 |
Student Assessment
* indicates total number of test takers is 10 or less.
Blank indicates no science assessment test administered.
|
| Achievement Level (%) | Science |
| District | State |
| Substantially Below Proficient (%) |
13
| 18 |
| Partially Proficient (%) |
49
| 46 |
| Proficient (%) |
38
| 35 |
| Proficient with Distinction (%) |
1
| 2 |
| Longitudinal Reports and Subgroup Reporting |
| Percent of students at each achievement level |
Math |
Reading |
Science |
|
|
|
| National Assessment of Educational Progress (NAEP) Student Achievement Data-Percent of NH Students At or Above Each Achievement Level (Based on the Winter 2015 NAEP Assessment) |
| NAEP achievement levels are indicated as follows: B+ for Basic or above, P+ for Proficient or above, and A for Advanced |
| Reading |
| Grade | B+ | P+ | A |
| 4 | 79 | 46 | 12 |
| 8 | 85 | 45 | 5 |
| Math |
| Grade | B+ | P+ | A |
| 4 | 91 | 51 | 10 |
| 8 | 84 | 46 | 12 |
|
|
|
|
|
New Hampshire Department of Education
101 Pleasant Street | Concord, NH | 03301-3494
Telephone: (603) 271-3494 | TDD Access: Relay NH 711
|
