View State Profile
Change District:
Schools
Newfields Elementary School
|
District:Newfields
|
View: State Profile
Home |
Compare |
Glossary
Select a School Year:
|
|
|
| General Information |
 |
District: Newfields
(387)
|
SAU: Exeter SAU Office (16) |
| Address: 30 Linden St., Exeter, NH 03833-2522 |
Telephone: |
| NCES District ID: 3305190 |
Fax: |
| Superintendent: Esther Asbell |
Web Site: |
| Federal Accountability Status Met:
Yes |
|
| District Report Card 2011-12 |
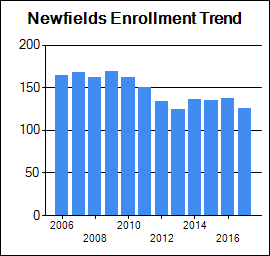
| Enrollment |
| | October 1 Enrollment | Average Class Size |
| Grade(s) | District | State | District | State |
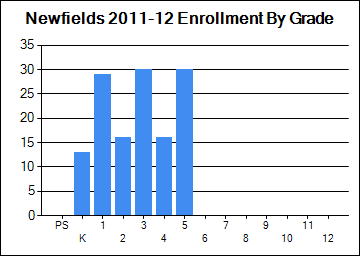
| PreSchool | 0 | 3,165 | | |
| Kindergarten | 13 | 11,904 | | |
| Readiness | 0 | 78 | | |
| Grade 1 | 29 | 13,595 | 14 | 18 |
| Grade 2 | 16 | 13,845 | 16 | 18 |
| Grade 3 | 30 | 13,876 | 15 | 19 |
| Grade 4 | 16 | 14,167 | 16 | 20 |
| Grade 5 | 30 | 14,200 | 15 | 20 |
| Grade 6 | 0 | 14,568 | 0 | 21 |
| Grade 7 | 0 | 14,811 | 0 | 21 |
| Grade 8 | 0 | 15,102 | 0 | 22 |
| Grade 9 | 0 | 16,465 | | |
| Grade 10 | 0 | 15,350 | | |
| Grade 11 | 0 | 14,985 | | |
| Grade 12 | 0 | 14,673 | | |
| Total Enrollment | 134 | 190,805 | | |
|
|
| School Safety |
| | District | State |
| School Safety Incidences | 0 | 1,505 |
| Total Number of Incidents | 0 | 23,633 |
| No. of Incidents/1,000 students | 0 | 124 |
|
| Attendance/Four-Year Graduation Rate |
| | District | State |
| PreSchool Attendance Rate | | 92 |
| Elem/Middle Attendance Rate (Target: 90%) | 96.2 | 95.5 |
| High School Four-Year Graduation Rate (Target: 85%) | | 86.6 |
[More Details]
|
|
| Teacher Quality |
| | District | State |
| N | % | N | % |
| Core Classes Taught by non-HQT | 0 | 0.0 | 3276 | 5.9 |
| Core Classes Taught by non-HQT in High-Poverty Schools | | N/A | | 1.2 |
| Core Classes Taught by non-HQT in Low-Poverty Schools | | 0.0 | | 1.5 |
| Employed Under Emergency Credentials | N/A | N/A | 5 | 0.04 |
| Bachelor's Degree | | 23.0 | | 39.5 |
| Master's Degree | | 77.0 | | 47.7 |
| Degree beyond Master's Degree | | 0.0 | | 0.8 |
[More Details]
|
|
| School Staff |
| | District | State |
| Teachers | 12 | 15,049 |
| Instructional Support | 10 | 6,964 |
| Librarians | 0 | 313 |
| Specialists | 1 | 2,550 |
| Admin Support | 1 | 1,245 |
| All Other Support | 2 | 3,598 |
[More Details]
|
|
| Improvement Status |
| Status for 2011-2012 School Year | Content Area | Met AYP Requirements | Status for 2012-2013 School Year |
| Acceptable | Reading | Yes | Acceptable |
| Acceptable | Math | Yes | Acceptable |
| Acceptable | Other | Yes | Acceptable |
| Statewide NCLB Accountability Status |
| | READING | MATHEMATICS |
| Schools | Districts | Schools | Districts |
| N | % | N | % | N | % | N | % |
| Acceptable | 279 | 60.5 | 105 | 65.6 | 241 | 52.3 | 82 | 51.6 |
| SINI/DINI Year 1 | 41 | 8.9 | 24 | 15.0 | 67 | 14.5 | 26 | 16.4 |
| SINI/DINI Year2 | 57 | 12.4 | 13 | 8.1 | 71 | 15.4 | 26 | 16.4 |
| Corrective Action/Level 3 | 37 | 8.0 | 13 | 8.1 | 34 | 7.4 | 11 | 6.9 |
| Restructure Planning/Level 4 | 23 | 5.0 | 3 | 1.9 | 27 | 5.9 | 9 | 5.7 |
| Restructuring/Level 5&6 | 24 | 5.2 | 2 | 1.3 | 21 | 4.6 | 5 | 3.1 |
| State Total | 461 | 100.0 | 160 | 100.0 | 461 | 100 | 159 | 100.0 |
|
|
| Assessment Rankings |
| Ranking School Type | Subject | Nbr. of Students | Index Score and Std Error | Index Score Ranking | No. of Students Prior Year | Prior Year Index Score and Std Error | Index Score Improvement | Index Score Improvement Ranking |
|
Elem/Middle | Math | 98 | 98.6 (+/-0.7) | 4 of 156 | 102 | 94.9 (+/-1.5) | 3.7 | 10 of 155 | |
Elem/Middle | Read | 99 | 96.8 (+/-1.3) | 18 of 156 | 102 | 94.5 (+/-1.4) | 2.3 | 18 of 155 | |
Elem/Middle | Write | 29 | 97.2 (+/-1.3) | 2 of 143 | 24 | 87.5 (+/-4.8) | 9.7 | 3 of 140 |
|
|
Student Assessment
* indicates total number of test takers is 10 or less.
Blank indicates no science assessment test administered.
|
| Achievement Level (%) | Reading | Mathematics | Writing | Science |
| District | State | District | State | District | State | District | State |
| Substantially Below Proficient (%) | 0 | 7 | 0 | 16 | 0 | 8 | 6 | 17 |
| Partially Proficient (%) | 8 | 15 | 3 | 17 | 17 | 37 | 19 | 43 |
| Proficient (%) | 54 | 54 | 55 | 43 | 73 | 45 | 75 | 37 |
| Proficient with Distinction (%) | 38 | 24 | 42 | 23 | 10 | 8 | 0 | 1 |
| Testing Participation (%) | 100 | 99 | 100 | 99 | 100 | 99 | 100 | 99 |
| For assessment rankings click on this link: | [Ranking Reports] |
| NECAP Longitudinal Reports |
| 1) NECAP Teaching Year District Tested at Grade Comparison |
Reading and Math |
| 2) NECAP Teaching Year District "Cohort" History Comparison |
Reading and Math |
| 3) NECAP Teaching Year District vs. State by Tested at Grade |
Math |
Reading |
| |
| 4) NECAP Teaching Year District vs. State by "Cohort" History |
Math |
Reading |
| |
| 5) NECAP Teaching Year District GAP Analysis by Tested at Grade |
Math |
Reading |
| |
| 6) NECAP and NH ALPs Teaching Year Average Index Score and GAP analysis |
Math |
Reading |
Science |
Writing |
| 7) NECAP and NH ALPs Teaching Year Percent of students at each index level |
Math |
Reading |
Science |
Writing |
| 8) NECAP and NH ALPs Teaching Year Median Student Growth Percentile (SGP) and GAP analysis |
Math |
Reading |
| |
| 9) NECAP and NH ALPs Teaching Year Percent of students at each Student Growth Percentile (SGP) Grouping |
Math |
Reading |
| |
|
|
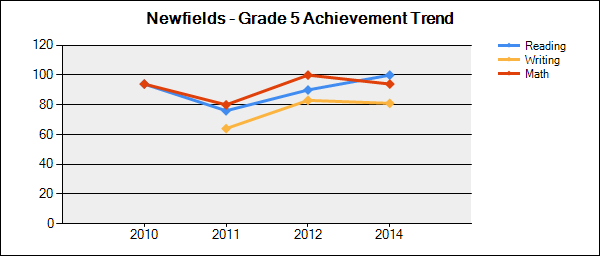
Student Achievement Trends
N is the number of students participating.
% is the percent of students scoring proficient or above.
Click on a grade to show the achievement trend for that grade. |
 |
| Grade | Content Area | 2009-2010 | 2010-2011 | 2011-2012 | 2012-2013 | 2013-2014 |
| N | % | N | % | N | % | N | % | N | % |
| 3 | Reading | 30 | 90 | 19 | 95 | 30 | 93 | 14 | 79 | 29 | 86 |
| Mathematics | 30 | 87 | 19 | 68 | 30 | 97 | 14 | 71 | 29 | 72 |
| 4 | Reading | 28 | 75 | 29 | 79 | 16 | 94 | 34 | 97 | 15 | 87 |
| Mathematics | 28 | 79 | 29 | 93 | 16 | 94 | 34 | 88 | 15 | 73 |
| 5 | Reading | 33 | 94 | 25 | 76 | 30 | 90 | 16 | 100 | 32 | 100 |
| Mathematics | 33 | 94 | 25 | 80 | 30 | 100 | 16 | 69 | 32 | 94 |
| Writing | 0 | | 25 | 64 | 30 | 83 | 16 | 81 | 32 | 81 |
|
|
| National Assessment of Educational Progress (NAEP) Student Achievement Data-Percent of NH Students At or Above Each Achievement Level (Based on the Winter 2011 NAEP Assessment) |
| NAEP achievement levels are indicated as follows: B+ for Basic or above, P+ for Proficient or above, and A for Advanced |
| Reading |
| Grade | B+ | P+ | A |
| 4 | 78 | 43 | 10 |
| 8 | 84 | 40 | 4 |
| Math |
| Grade | B+ | P+ | A |
| 4 | 92 | 57 | 11 |
| 8 | 82 | 44 | 11 |
|
|
|
|
|

