View State Profile
Change District:
Schools
Iber Holmes Gove Middle School
Lamprey River Elementary School
Raymond High School
|
District:Raymond
|
View: State Profile
Home |
Compare |
Glossary
Select a School Year:
|
|
|
| General Information |
 |
District: Raymond
(453)
|
SAU: Raymond SAU Office (33) |
| Address: 43 Harriman Hill Rd., Raymond, NH 03077-1509 |
Telephone: 603-895-4299 |
| NCES District ID: 3305880 |
Fax: |
| Superintendent: Terrence Leatherman |
Web Site: |
| |
| District Report Card 2015-16 |
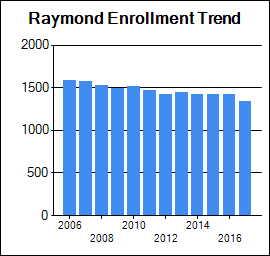
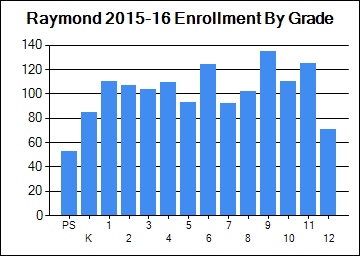
| Enrollment |
| | October 1 Enrollment | Average Class Size |
| Grade(s) | District | State | District | State |
| PreSchool | 53 | 3,670 | | |
| Kindergarten | 85 | 11,187 | | |
| Readiness | 0 | 45 | | |
| Grade 1 | 110 | 12,898 | 16 | 17 |
| Grade 2 | 107 | 13,186 | 15 | 18 |
| Grade 3 | 104 | 13,450 | 17 | 19 |
| Grade 4 | 109 | 13,613 | 22 | 19 |
| Grade 5 | 93 | 13,594 | 23 | 20 |
| Grade 6 | 124 | 14,015 | 21 | 20 |
| Grade 7 | 92 | 14,030 | 15 | 21 |
| Grade 8 | 102 | 14,216 | 17 | 21 |
| Grade 9 | 135 | 15,169 | | |
| Grade 10 | 110 | 14,578 | | |
| Grade 11 | 125 | 13,923 | | |
| Grade 12 | 71 | 13,752 | | |
| Total Enrollment | 1420 | 181,339 | | |
|
|
| School Safety |
| | District | State |
| School Safety Incidences | 24 | 928 |
| Total Number of Incidents | 59 | 5,885 |
| No. of Incidents/1,000 students | 42 | 32 |
|
| Attendance/Four-Year Graduation Rate |
| | District | State |
| PreSchool Attendance Rate | | 94.8 |
| Elem/Middle Attendance Rate (Target: 90%) | 94.9 | 95.4 |
| High School Four-Year Graduation Rate (Target: 90%) | 0 | 88.2 |
[More Details]
|
|
|
|
| School Staff |
| | District | State |
| Teachers | 113 | 14,770 |
| Instructional Support | 63 | 7,044 |
| Librarians | 3 | 321 |
| Specialists | 23 | 2,743 |
| Admin Support | 10 | 1,237 |
| All Other Support | 33 | 3,612 |
[More Details]
|
|
| State and Federal Accountability |
|
|
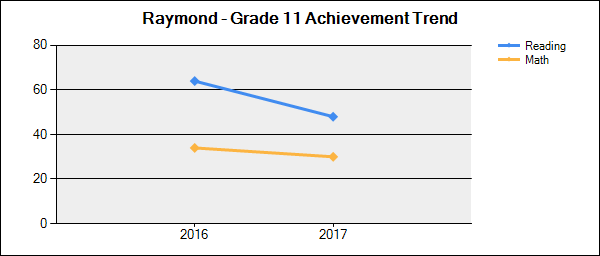
Student Achievement Trends
N is the number of students participating.
% is the percent of students scoring proficient or above.
Click on a grade to show the achievement trend for that grade.
Note: Grade 11 results are from the new SAT assessment tests and not comparable to 2014-2015 |
 |
| Grade | Content Area | 2014-2015 | 2015-2016 |
| N | % | N | % |
| 3 | Reading |
105 | 53 | 97 | 45 | | Mathematics |
105 | 43 | 96 | 47 | | 4 | Reading |
82 | 54 | 101 | 41 | | Mathematics |
82 | 44 | 102 | 36 | | 5 | Reading |
118 | 60 | 89 | 54 | | Mathematics |
118 | 34 | 89 | 29 | | 6 | Reading |
97 | 60 | 116 | 60 | | Mathematics |
96 | 47 | 116 | 29 | | 7 | Reading |
96 | 53 | 89 | 66 | | Mathematics |
95 | 47 | 90 | 52 | | 8 | Reading |
100 | 53 | 97 | 46 | | Mathematics |
99 | 38 | 97 | 41 | | 11 | Reading |
80 | 44 | 97 | 64 | | Mathematics |
79 | 25 | 97 | 34 |
|
|
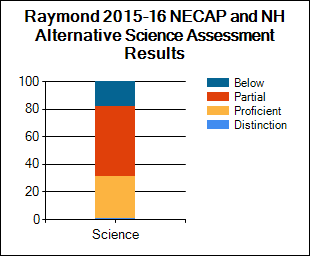
| NECAP and NH Alternative Assessment Science Results 2015-16 |
Student Assessment
* indicates total number of test takers is 10 or less.
Blank indicates no science assessment test administered.
|
| Achievement Level (%) | Science |
| District | State |
| Substantially Below Proficient (%) |
18
| 19 |
| Partially Proficient (%) |
51
| 45 |
| Proficient (%) |
30
| 34 |
| Proficient with Distinction (%) |
1
| 2 |
| Longitudinal Reports and Subgroup Reporting |
| Percent of students at each achievement level |
Math |
Reading |
Science |
|
|
|
| National Assessment of Educational Progress (NAEP) Student Achievement Data-Percent of NH Students At or Above Each Achievement Level (Based on the Winter 2015 NAEP Assessment) |
| NAEP achievement levels are indicated as follows: B+ for Basic or above, P+ for Proficient or above, and A for Advanced |
| Reading |
| Grade | B+ | P+ | A |
| 4 | 79 | 46 | 12 |
| 8 | 85 | 45 | 5 |
| Math |
| Grade | B+ | P+ | A |
| 4 | 91 | 51 | 10 |
| 8 | 84 | 46 | 12 |
|
|
|
|
|
New Hampshire Department of Education
101 Pleasant Street | Concord, NH | 03301-3494
Telephone: (603) 271-3494 | TDD Access: Relay NH 711
|
