View State Profile
Select a District:
|
State of New Hampshire
|
View: State Profile
Home |
Compare |
Glossary
Select a School Year:
|
|
|
| General Information |
 |
State: New Hampshire Public Schools |
Telephone: (603) 271-3494 |
| Address: 101 Pleasant Street, Concord, NH 03301-3494 |
Fax: (603) 271-1953 |
| Commissioner: Frank Edelblut |
Web Site: http://www.education.nh.gov/ |
| State Report Card 2011-12 |
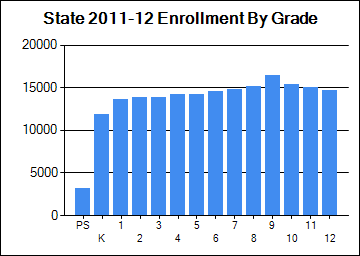
| Enrollment |
| | October 1 Enrollment | Average Class Size |
| Grade(s) | State | State |
| PreSchool | 3,165 | |
| Kindergarten | 11,904 | |
| Readiness | 78 | |
| Grade 1 | 13,595 | 18 |
| Grade 2 | 13,845 | 18 |
| Grade 3 | 13,876 | 19 |
| Grade 4 | 14,167 | 20 |
| Grade 5 | 14,200 | 20 |
| Grade 6 | 14,568 | 21 |
| Grade 7 | 14,811 | 21 |
| Grade 8 | 15,102 | 22 |
| Grade 9 | 16,465 | |
| Grade 10 | 15,350 | |
| Grade 11 | 14,985 | |
| Grade 12 | 14,673 | |
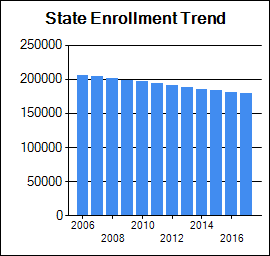
| Total Enrollment | 190,805 | |
|
|
| School Safety |
| | State |
| School Safety Incidences | 1,505 |
| Total Number of Incidents | 23,633 |
| No. of Incidents/1,000 students | 124 |
|
| Attendance/Four-Year Graduation Rate |
| | State |
| PreSchool Attendance Rate | 92 |
| Elem/Middle Attendance Rate (Target: 90%) | 95.5 |
| High School Four-Year Graduation Rate (Target: 85%) | 86.6 |
[More Details]
|
|
| Teacher Quality |
| | State |
| N | % |
| Core Classes Taught by non-HQT | 3276 | 5.9 |
| Core Classes Taught by non-HQT in High-Poverty Schools | | 1.2 |
| Core Classes Taught by non-HQT in Low-Poverty Schools | | 1.5 |
| Employed Under Emergency Credentials | 5 | 0.04 |
| Bachelor's Degree | | 39.5 |
| Master's Degree | | 47.7 |
| Degree beyond Master's Degree | | 0.8 |
[More Details]
|
|
| School Staff |
| | State |
| Teachers | 15,049 |
| Instructional Support | 6,964 |
| Librarians | 313 |
| Specialists | 2,550 |
| Admin Support | 1,245 |
| All Other Support | 3,598 |
[More Details]
|
|
| Improvement Status |
| Statewide NCLB Accountability Status |
| | READING | MATHEMATICS |
| Schools | Districts | Schools | Districts |
| N | % | N | % | N | % | N | % |
| Acceptable | 279 | 60.5 | 105 | 65.6 | 241 | 52.3 | 82 | 51.6 |
| SINI/DINI Year 1 | 41 | 8.9 | 24 | 15.0 | 67 | 14.5 | 26 | 16.4 |
| SINI/DINI Year2 | 57 | 12.4 | 13 | 8.1 | 71 | 15.4 | 26 | 16.4 |
| Corrective Action/Level 3 | 37 | 8.0 | 13 | 8.1 | 34 | 7.4 | 11 | 6.9 |
| Restructure Planning/Level 4 | 23 | 5.0 | 3 | 1.9 | 27 | 5.9 | 9 | 5.7 |
| Restructuring/Level 5&6 | 24 | 5.2 | 2 | 1.3 | 21 | 4.6 | 5 | 3.1 |
| State Total | 461 | 100.0 | 160 | 100.0 | 461 | 100 | 159 | 100.0 |
|
|
| Assessment Rankings |
| Ranking School Type | Subject | Nbr. of Students | Index Score and Std Error | Index Score Ranking | No. of Students Prior Year | Prior Year Index Score and Std Error | Index Score Improvement | Index Score Improvement Ranking |
|
Elem/Middle | Math | 84405 | 87.4 | 105 of 156 | 85879 | 87.3 | 0.1 | 76 of 155 | |
Elem/Middle | Read | 84445 | 91.7 | 109 of 156 | 85893 | 91.5 | 0.2 | 85 of 155 | |
Elem/Middle | Write | 28572 | 85.5 (+/-0.1) | 90 of 143 | 29147 | 86.8 (+/-0.1) | -1.3 | 78 of 140 | |
High School | Math | 14344 | 67.2 (+/-0.3) | 40 of 76 | 14612 | 66.8 (+/-0.3) | 0.4 | 46 of 76 | |
High School | Read | 14365 | 90.4 (+/-0.2) | 45 of 76 | 14630 | 89.4 (+/-0.2) | 1 | 40 of 76 | |
High School | Write | - | - | - | - | - | - | - |
|
|
Student Assessment
* indicates total number of test takers is 10 or less.
Blank indicates no science assessment test administered.
|
| Achievement Level (%) | Reading | Mathematics | Writing | Science |
| State | State | State | State |
| Substantially Below Proficient (%) | 7 | 16 | 8 | 17 |
| Partially Proficient (%) | 15 | 17 | 37 | 43 |
| Proficient (%) | 54 | 43 | 45 | 37 |
| Proficient with Distinction (%) | 24 | 23 | 8 | 1 |
| For assessment rankings click on this link: | [Ranking Reports] |
| NECAP Longitudinal Reports |
| 1) NECAP Teaching Year District Tested at Grade Comparison |
Reading and Math |
| 2) NECAP Teaching Year District "Cohort" History Comparison |
Reading and Math |
| 3) NECAP Teaching Year District vs. State by Tested at Grade |
Math |
Reading |
| |
| 4) NECAP Teaching Year District vs. State by "Cohort" History |
Math |
Reading |
| |
| 5) NECAP Teaching Year District GAP Analysis by Tested at Grade |
Math |
Reading |
| |
| 6) NECAP and NH ALPs Teaching Year Average Index Score and GAP analysis |
Math |
Reading |
Science |
Writing |
| 7) NECAP and NH ALPs Teaching Year Percent of students at each index level |
Math |
Reading |
Science |
Writing |
| 8) NECAP and NH ALPs Teaching Year Median Student Growth Percentile (SGP) and GAP analysis |
Math |
Reading |
| |
| 9) NECAP and NH ALPs Teaching Year Percent of students at each Student Growth Percentile (SGP) Grouping |
Math |
Reading |
| |
|
|
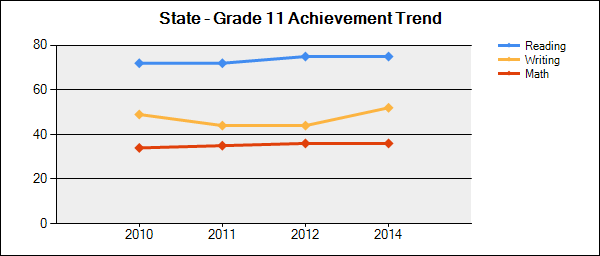
Student Achievement Trends
N is the number of students participating.
% is the percent of students scoring proficient or above.
Click on a grade to show the achievement trend for that grade. |
 |
| Grade | Content Area | 2009-2010 | 2010-2011 | 2011-2012 | 2012-2013 | 2013-2014 |
| N | % | N | % | N | % | N | % | N | % |
| 3 | Reading | 14252 | 81 | 14120 | 80 | 13874 | 80 | 13827 | 78 | 13528 | 76 |
| Mathematics | 14272 | 76 | 14157 | 76 | 13899 | 75 | 13850 | 73 | 13556 | 70 |
| 4 | Reading | 14544 | 76 | 14237 | 77 | 14155 | 78 | 13882 | 77 | 13915 | 75 |
| Mathematics | 14562 | 74 | 14258 | 74 | 14181 | 76 | 13910 | 76 | 13938 | 72 |
| 5 | Reading | 14703 | 78 | 14541 | 78 | 14217 | 76 | 14227 | 77 | 13949 | 78 |
| Mathematics | 14716 | 74 | 14581 | 73 | 14247 | 75 | 14249 | 73 | 13965 | 72 |
| Writing | 0 | | 14552 | 56 | 14214 | 54 | 14225 | 57 | 13947 | 61 |
| 6 | Reading | 15085 | 75 | 14763 | 77 | 14585 | 79 | 14278 | 79 | 14255 | 77 |
| Mathematics | 15107 | 72 | 14785 | 71 | 14600 | 72 | 14289 | 73 | 14270 | 69 |
| 7 | Reading | 15373 | 76 | 15168 | 72 | 14817 | 76 | 14676 | 76 | 14354 | 74 |
| Mathematics | 15391 | 66 | 15201 | 66 | 14854 | 67 | 14699 | 68 | 14382 | 68 |
| 8 | Reading | 15573 | 75 | 15391 | 78 | 15135 | 81 | 14748 | 81 | 14647 | 77 |
| Mathematics | 15596 | 65 | 15432 | 65 | 15161 | 67 | 14778 | 66 | 14672 | 64 |
| Writing | 0 | | 15408 | 64 | 15116 | 61 | 14740 | 67 | 14643 | 56 |
| 11 | Reading | 15396 | 72 | 15254 | 72 | 14956 | 75 | 14642 | 75 | 14265 | 75 |
| Mathematics | 15410 | 34 | 15279 | 35 | 14974 | 36 | 14670 | 37 | 14287 | 36 |
| Writing | 15400 | 49 | 15273 | 44 | 14967 | 44 | 14644 | 40 | 14266 | 52 |
|
|
| National Assessment of Educational Progress (NAEP) Student Achievement Data-Percent of NH Students At or Above Each Achievement Level (Based on the Winter 2011 NAEP Assessment) |
| NAEP achievement levels are indicated as follows: B+ for Basic or above, P+ for Proficient or above, and A for Advanced |
| Reading |
| Grade | B+ | P+ | A |
| 4 | 78 | 43 | 10 |
| 8 | 84 | 40 | 4 |
| Math |
| Grade | B+ | P+ | A |
| 4 | 92 | 57 | 11 |
| 8 | 82 | 44 | 11 |
|
|
|
|
|

