View State Profile
Return to Londonderry District
Schools
Londonderry Middle School
Londonderry Senior High School
Matthew Thornton Elementary School
Moose Hill School
North Londonderry Elementary School
South Londonderry Elementary School
|
School:Londonderry Middle School
|
View: State Profile
Home |
Compare |
Glossary
Select a School Year:
|
|
|
| General Information |
 |
School: Londonderry Middle School (20480) |
NCES School ID: 00232 |
| District: Londonderry (319) |
NCES District ID: 3304410 |
| SAU: Londonderry SAU Office (12) |
School Web Site: www.londonderry.org/lms |
| Superintendent: Daniel Black |
SAU Telephone: 603-432-6920 |
| Interim: William Van Bennekum |
School Telephone: 603-432-6925 |
| Address: 313 Mammoth Rd., Londonderry, NH 03053-3037 |
School Fax: 603-432-0714 |
| School Open Date:
| School Close Date:
|
| School Type: Public School |
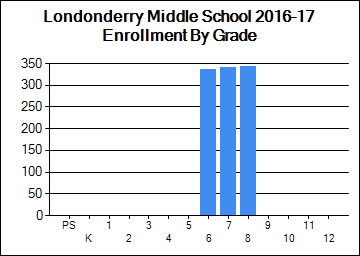
Grades Offered: 6-8 |
| Federal Accountability Status:
None Assigned |
NH Adequacy Status Met: N/A |
| School Report Card 2016-17 |
| Enrollment |
| | October 1 Enrollment | Average Class Size |
| Grade(s) | School | District | State | School | District | State |
| PreSchool | 0 | 115 | 3,894 | | | |
| Kindergarten | 0 | 283 | 11,422 | | | |
| Readiness | 0 | 0 | 65 | | | |
| Grade 1 | 0 | 283 | 12,378 | 0 | 19 | 17 |
| Grade 2 | 0 | 263 | 12,885 | 0 | 20 | 18 |
| Grade 3 | 0 | 300 | 13,309 | 0 | 20 | 19 |
| Grade 4 | 0 | 305 | 13,612 | 0 | 22 | 19 |
| Grade 5 | 0 | 299 | 13,718 | 0 | 21 | 20 |
| Grade 6 | 336 | 336 | 13,722 | 0 | 0 | 20 |
| Grade 7 | 341 | 341 | 14,102 | 0 | 0 | 21 |
| Grade 8 | 343 | 343 | 14,075 | 0 | 0 | 21 |
| Grade 9 | 0 | 356 | 15,139 | | | |
| Grade 10 | 0 | 375 | 14,292 | | | |
| Grade 11 | 0 | 402 | 13,785 | | | |
| Grade 12 | 0 | 388 | 13,338 | | | |
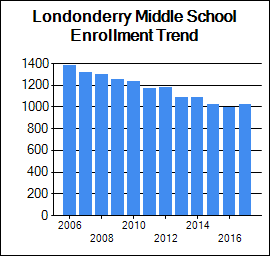
| Total Enrollment | 1020 | 4,389 | 179,737 | | | |
|
|
| School Safety |
| | School | District | State |
| School Safety Incidences | 15 | 15 | 1,073 |
| Total Number of Incidents | 17 | 69 | 6,825 |
| No. of Incidents/1,000 students | 17 | 16 | 38 |
[View Safety Survey]
|
| Attendance/Four-Year Graduation Rate |
| | School | District | State |
| PreSchool Attendance Rate | | | 89.8 |
| Elem/Middle Attendance Rate (Target: 90%) | 95.3 | 95.9 | 95.1 |
| High School Four-Year Graduation Rate (Target: 90%) | | 96 | 89 |
[More Details]
|
|
|
|
| School Staff |
| | School | District | State |
| Teachers | 83 | 319 | 14,758 |
| Instructional Support | 34 | 153 | 6,980 |
| Librarians | 3 | 9 | 324 |
| Specialists | 16 | 70 | 2,772 |
| Admin Support | 5 | 25 | 1,247 |
| All Other Support | 22 | 83 | 3,241 |
[More Details]
|
|
| State and Federal Accountability |
|
|
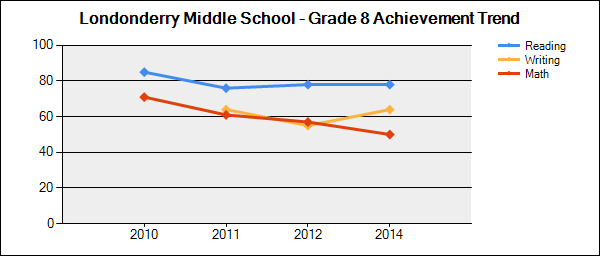
Student Achievement Trends
N is the number of students participating.
% is the percent of students scoring proficient or above.
Click on a grade to show the achievement trend for that grade.
Note: Grade 11 results are from the new SAT assessment tests and not comparable to 2014-2015 |
 |
| Grade | Content Area | 2015-2016 | 2016-2017 |
| N | % | N | % |
| 6 | Reading |
308 | 69 | 314 | 54 | | Mathematics |
308 | 45 | 314 | 40 | | 7 | Reading |
306 | 75 | 320 | 68 | | Mathematics |
306 | 67 | 319 | 56 | | 8 | Reading |
297 | 67 | 308 | 59 | | Mathematics |
298 | 52 | 306 | 47 |
|
|
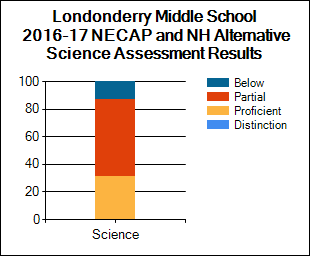
| NECAP and NH Alternative Assessment Science Results 2016-17 |
Student Assessment
* indicates total number of test takers is 10 or less.
Blank indicates no science assessment test administered.
|
| Achievement Level (%) | Science |
| School | District | State |
| Substantially Below Proficient (%) |
13
|
16
| 18 |
| Partially Proficient (%) |
56
|
50
| 46 |
| Proficient (%) |
31
|
34
| 35 |
| Proficient with Distinction (%) |
0
|
0
| 2 |
| Longitudinal Reports and Subgroup Reporting |
| Percent of students at each achievement level |
Math |
Reading |
Science |
|
|
|
| National Assessment of Educational Progress (NAEP) Student Achievement Data-Percent of NH Students At or Above Each Achievement Level (Based on the Winter 2015 NAEP Assessment) |
| NAEP achievement levels are indicated as follows: B+ for Basic or above, P+ for Proficient or above, and A for Advanced |
| Reading |
| Grade | B+ | P+ | A |
| 4 | 79 | 46 | 12 |
| 8 | 85 | 45 | 5 |
| Math |
| Grade | B+ | P+ | A |
| 4 | 91 | 51 | 10 |
| 8 | 84 | 46 | 12 |
|
|
|
|
|
New Hampshire Department of Education
101 Pleasant Street | Concord, NH | 03301-3494
Telephone: (603) 271-3494 | TDD Access: Relay NH 711
|
