View State Profile
Return to Franklin District
Schools
Bessie C. Rowell School
Franklin - Pre School Program
Franklin High School
Franklin Middle School
Paul A. Smith School
|
School:Bessie C. Rowell School
|
View: State Profile
Home |
Compare |
Glossary
Select a School Year:
|
|
|
| General Information |
 |
School: Bessie C. Rowell School (20640) |
NCES School ID: 00127 |
| District: Franklin (185) |
NCES District ID: 3303090 |
| SAU: Franklin SAU Office (18) |
School Web Site: |
| Superintendent: Daniel LeGallo |
SAU Telephone: 603-934-3108 |
| Principal: Not Listed |
School Telephone: 603-934-5116 |
| Address: 20 Rowell Dr., Franklin, NH 03235-1226 |
School Fax: 603-934-7452 |
| School Open Date:
| School Close Date:
6/30/2011 |
| School Type: Public School |
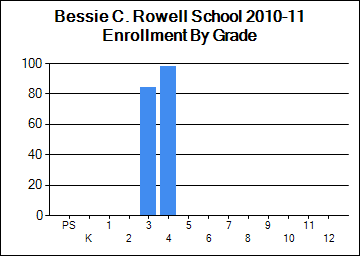
Grades Offered: 3-4 |
| Federal Accountability Status Met:
Yes |
NH Accountability Status Met: N/A |
| School Report Card 2010-11 |
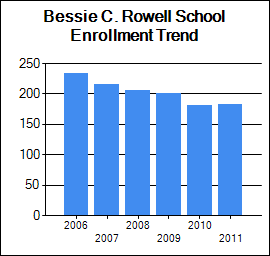
| Enrollment |
| | October 1 Enrollment | Average Class Size |
| Grade(s) | School | District | State | School | District | State |
| PreSchool | 0 | 15 | 3,095 | | | |
| Kindergarten | 0 | 79 | 11,922 | | | |
| Readiness | 0 | 0 | 126 | | | |
| Grade 1 | 0 | 107 | 13,956 | 0 | 18 | 17 |
| Grade 2 | 0 | 87 | 13,884 | 0 | 17 | 18 |
| Grade 3 | 84 | 84 | 14,156 | 21 | 21 | 19 |
| Grade 4 | 98 | 98 | 14,239 | 16 | 16 | 19 |
| Grade 5 | 0 | 85 | 14,547 | 0 | 0 | 20 |
| Grade 6 | 0 | 103 | 14,745 | 0 | 0 | 20 |
| Grade 7 | 0 | 112 | 15,132 | 0 | 0 | 22 |
| Grade 8 | 0 | 116 | 15,338 | 0 | 0 | 22 |
| Grade 9 | 0 | 149 | 16,764 | | | |
| Grade 10 | 0 | 109 | 15,930 | | | |
| Grade 11 | 0 | 93 | 15,220 | | | |
| Grade 12 | 0 | 89 | 14,947 | | | |
| Total Enrollment | 182 | 1,326 | 194,022 | | | |
|
|
| School Safety |
| | School | District | State |
| School Safety Incidences | 1 | 2 | 1,534 |
| Total Number of Incidents | 12 | 388 | 21,207 |
| No. of Incidents/1,000 students | 66 | 293 | 109 |
[View Safety Survey]
|
| Attendance/Four-Year Graduation Rate |
| | School | District | State |
| PreSchool Attendance Rate | | 89.2 | 92.3 |
| Elem/Middle Attendance Rate (Target: 90%) | 95.2 | 94.6 | 95.4 |
| High School Four-Year Graduation Rate (Target: 80%) | | 78.5 | 86.6 |
[More Details]
|
|
| Teacher Quality |
| | School | District | State |
| N | % | N | % | N | % |
| Core Classes Taught by non-HQT | 0 | 0.0 | 0 | 0.0 | 227 | 0.7 |
| Core Classes Taught by non-HQT in High-Poverty Schools | | 0.0 | | 0.0 | | 0.3 |
| Core Classes Taught by non-HQT in Low-Poverty Schools | | N/A | | N/A | | 0.1 |
| Employed Under Emergency Credentials | N/A | N/A | N/A | N/A | 46 | 0.4 |
| Bachelor's Degree | | N/C | | 80.1 | | 46.0 |
| Master's Degree | | N/C | | 19.9 | | 52.9 |
| Degree beyond Master's Degree | | N/C | | 0.0 | | 0.8 |
[More Details]
|
|
| School Staff |
| | School | District | State |
| Teachers | 16 | 104 | 15,365 |
| Instructional Support | 18 | 77 | 7,356 |
| Librarians | 0 | 2 | 330 |
| Specialists | 6 | 25 | 2,602 |
| Admin Support | 1 | 7 | 1,262 |
| All Other Support | 6 | 27 | 3,808 |
[More Details]
|
|
| Improvement Status |
| Status for 2010-2011 School Year | Content Area | Met AYP Requirements | Status for 2011-2012 School Year |
| Restructuring/Level 5 | Reading | No | Restructuring/Level 5 |
| Restructure Planning/Level 4 | Math | No | Restructure Planning/Level 4 |
| Acceptable | Other | Yes | Acceptable |
| Statewide NCLB Accountability Status |
| | READING | MATHEMATICS |
| Schools | Districts | Schools | Districts |
| N | % | N | % | N | % | N | % |
| Acceptable | 279 | 60.5 | 105 | 66.5 | 241 | 52.3 | 82 | 51.6 |
| SINI/DINI Year 1 | 41 | 8.9 | 24 | 15.2 | 67 | 14.5 | 26 | 16.4 |
| SINI/DINI Year2 | 57 | 12.4 | 13 | 8.2 | 71 | 15.4 | 26 | 16.4 |
| Corrective Action/Level 3 | 37 | 8.0 | 13 | 8.2 | 34 | 7.4 | 11 | 6.9 |
| Restructure Planning/Level 4 | 23 | 5.0 | 3 | 1.9 | 27 | 5.9 | 9 | 5.7 |
| Restructuring/Level 5&6 | 24 | 5.2 | 0 | 0.0 | 21 | 4.6 | 5 | 3.1 |
| State Total | 461 | 100.0 | 158 | 100.0 | 461 | 100 | 159 | 100.0 |
|
|
Student Assessment
* indicates total number of test takers is 10 or less.
Blank indicates no science assessment test administered.
|
| Achievement Level (%) | Reading | Mathematics | Writing | Science |
| School | District | State | School | District | State | School | District | State | School | District | State |
| Substantially Below Proficient (%) | 9 | 11 | 7 | 14 | 27 | 15 | | 13 | 6 | 19 | 37 | 19 |
| Partially Proficient (%) | 20 | 26 | 17 | 21 | 25 | 18 | | 46 | 37 | 50 | 46 | 45 |
| Proficient (%) | 62 | 51 | 56 | 46 | 36 | 44 | | 35 | 46 | 31 | 17 | 35 |
| Proficient with Distinction (%) | 8 | 10 | 21 | 19 | 10 | 22 | | 4 | 9 | 0 | 0 | 1 |
| Testing Participation (%) | 100 | 99 | 99 | 100 | 99 | 99 | | 97 | 99 | 100 | 99 | 99 |
| For assessment rankings click on this link: | [Ranking Reports] |
| NECAP Longitudinal Reports |
| 1) NECAP Teaching Year District Tested at Grade Comparison |
Reading and Math |
| 2) NECAP Teaching Year District "Cohort" History Comparison |
Reading and Math |
| 3) NECAP Teaching Year District vs. State by Tested at Grade |
Math |
Reading |
| |
| 4) NECAP Teaching Year District vs. State by "Cohort" History |
Math |
Reading |
| |
| 5) NECAP Teaching Year District GAP Analysis by Tested at Grade |
Math |
Reading |
| |
| 6) NECAP and NH ALPs Teaching Year Average Index Score and GAP analysis |
Math |
Reading |
Science |
Writing |
| 7) NECAP and NH ALPs Teaching Year Percent of students at each index level |
Math |
Reading |
Science |
Writing |
| 8) NECAP and NH ALPs Teaching Year Median Student Growth Percentile (SGP) and GAP analysis |
Math |
Reading |
| |
| 9) NECAP and NH ALPs Teaching Year Percent of students at each Student Growth Percentile (SGP) Grouping |
Math |
Reading |
| |
|
|
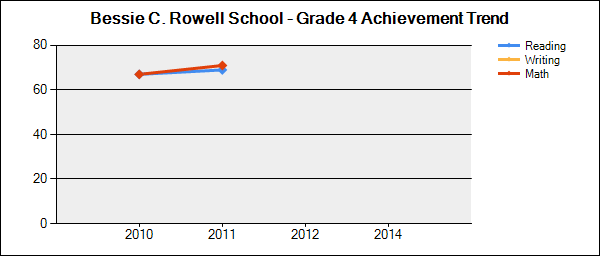
Student Achievement Trends
N is the number of students participating.
% is the percent of students scoring proficient or above.
Click on a grade to show the achievement trend for that grade. |
 |
| Grade | Content Area | 2009-2010 | 2010-2011 | 2011-2012 | 2012-2013 | 2013-2014 |
| N | % | N | % | N | % | N | % | N | % |
| 3 | Reading | 93 | 73 | 85 | 72 | | | | | | |
| Mathematics | 93 | 74 | 85 | 56 | | | | | | |
| 4 | Reading | 87 | 67 | 98 | 69 | | | | | | |
| Mathematics | 87 | 67 | 98 | 71 | | | | | | |
|
|
| National Assessment of Educational Progress (NAEP) Student Achievement Data-Percent of NH Students At or Above Each Achievement Level (Based on the Winter 2009 NAEP Assessment) |
| NAEP achievement levels are indicated as follows: B+ for Basic or above, P+ for Proficient or above, and A for Advanced |
| Reading |
| Grade | B+ | P+ | A |
| 4 | 77 | 41 | 9 |
| 8 | 81 | 39 | 4 |
| Math |
| Grade | B+ | P+ | A |
| 4 | 92 | 56 | 10 |
| 8 | 82 | 43 | 11 |
|
|
|
|
|

