View State Profile
Return to Monadnock Regional District
Schools
Cutler Elementary School
Dr. George S. Emerson Elementary School
Gilsum STEAM Academy
Monadnock Regional High School
Monadnock Regional Middle School
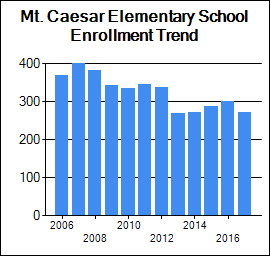
Mt. Caesar Elementary School
Troy Elementary School
|
School:Mt. Caesar Elementary School
|
View: State Profile
Home |
Compare |
Glossary
Select a School Year:
|
|
|
| General Information |
 |
School: Mt. Caesar Elementary School (21695) |
NCES School ID: 00302 |
| District: Monadnock Regional (363) |
NCES District ID: 3304890 |
| SAU: Monadnock Regional SAU Office (93) |
School Web Site: www.mrsd.org/Domain/405 |
| Superintendent: Jeremy Rathbun |
SAU Telephone: 603-352-6955 |
| Admin Principal: Melissa Suarez |
School Telephone: 603-352-4797 |
| Address: 585 Old Homstead Hwy., E. Swanzey, NH 03446-2309 |
School Fax: 603-352-1713 |
| School Open Date:
| School Close Date:
|
| School Type: Public School |
Grades Offered: P K 1-2 |
| Federal Accountability Status:
None Assigned |
NH Adequacy Status Met: N/A |

| School Report Card 2015-16 |
| Enrollment |
| | October 1 Enrollment | Average Class Size |
| Grade(s) | School | District | State | School | District | State |
| PreSchool | 49 | 87 | 3,670 | | | |
| Kindergarten | 90 | 142 | 11,187 | | | |
| Readiness | 0 | 0 | 45 | | | |
| Grade 1 | 82 | 128 | 12,898 | 20 | 20 | 17 |
| Grade 2 | 80 | 130 | 13,186 | 20 | 20 | 18 |
| Grade 3 | 0 | 118 | 13,450 | 0 | 22 | 19 |
| Grade 4 | 0 | 100 | 13,613 | 0 | 18 | 19 |
| Grade 5 | 0 | 112 | 13,594 | 0 | 18 | 20 |
| Grade 6 | 0 | 108 | 14,015 | 0 | 21 | 20 |
| Grade 7 | 0 | 138 | 14,030 | 0 | 0 | 21 |
| Grade 8 | 0 | 109 | 14,216 | 0 | 0 | 21 |
| Grade 9 | 0 | 143 | 15,169 | | | |
| Grade 10 | 0 | 127 | 14,578 | | | |
| Grade 11 | 0 | 132 | 13,923 | | | |
| Grade 12 | 0 | 126 | 13,752 | | | |
| Total Enrollment | 301 | 1,700 | 181,339 | | | |
|
|
| School Safety |
| | School | District | State |
| School Safety Incidences | 0 | 9 | 928 |
| Total Number of Incidents | 0 | 30 | 5,885 |
| No. of Incidents/1,000 students | 0 | 18 | 32 |
[View Safety Survey]
|
| Attendance/Four-Year Graduation Rate |
| | School | District | State |
| PreSchool Attendance Rate | | | 94.8 |
| Elem/Middle Attendance Rate (Target: 90%) | 94.4 | 94.8 | 95.4 |
| High School Four-Year Graduation Rate (Target: 90%) | | 0 | 88.2 |
[More Details]
|
|
|
|
| School Staff |
| | School | District | State |
| Teachers | 19 | 133 | 14,770 |
| Instructional Support | 15 | 74 | 7,044 |
| Librarians | 0 | 1 | 321 |
| Specialists | 12 | 36 | 2,743 |
| Admin Support | 1 | 11 | 1,237 |
| All Other Support | 1 | 32 | 3,612 |
[More Details]
|
|
| State and Federal Accountability |
| New Hampshire School Adequacy Summary |
| Met Input-Based Accountability System (IBAS): |
N/A
|
| Met Performance-Based School Accountability System (PBAS): |
N/A
|
| Performance Score: |
N/A
|
| Provides Opportunity for an Adequate Education: |
N/A
|
|
|
Student Achievement Trends
N is the number of students participating.
% is the percent of students scoring proficient or above.
Click on a grade to show the achievement trend for that grade.
Note: Grade 11 results are from the new SAT assessment tests and not comparable to 2014-2015 |
|
| Grade | Content Area | 2014-2015 | 2015-2016 |
| N | % | N | % |
| 3 | Reading |
| | | | | Mathematics |
| | | |
|
|
| NECAP and NH Alternative Assessment Science Results 2015-16 |
Student Assessment
* indicates total number of test takers is 10 or less.
Blank indicates no science assessment test administered.
|
|
|
|
|
| National Assessment of Educational Progress (NAEP) Student Achievement Data-Percent of NH Students At or Above Each Achievement Level (Based on the Winter 2015 NAEP Assessment) |
| NAEP achievement levels are indicated as follows: B+ for Basic or above, P+ for Proficient or above, and A for Advanced |
| Reading |
| Grade | B+ | P+ | A |
| 4 | 79 | 46 | 12 |
| 8 | 85 | 45 | 5 |
| Math |
| Grade | B+ | P+ | A |
| 4 | 91 | 51 | 10 |
| 8 | 84 | 46 | 12 |
|
|
|
|
|

