View State Profile
Return to Shaker Regional District
Schools
Belmont Elementary School
Belmont High School
Belmont Middle School
Canterbury Elementary School
|
School:Belmont Elementary School
|
View: State Profile
Home |
Compare |
Glossary
Select a School Year:
|
|
|
| General Information |
 |
School: Belmont Elementary School (22135) |
NCES School ID: 00490 |
| District: Shaker Regional (486) |
NCES District ID: 3306180 |
| SAU: Shaker Regional SAU Office (80) |
School Web Site: https://bes.sau80.org |
| Superintendent: Michael Tursi |
SAU Telephone: 603-267-9223 |
| Admin Principal: Benjamin Hill |
School Telephone: 603-267-6568 |
| Address: 26 Best St., Belmont, NH 03220-4201 |
School Fax: 603-267-6136 |
| School Open Date:
| School Close Date:
|
| School Type: Public School |
Grades Offered: P K 1-4 |
| Federal Accountability Status:
None Assigned |
NH Adequacy Status Met: N/A |
| School Report Card 2014-15 |
| Enrollment |
| | October 1 Enrollment | Average Class Size |
| Grade(s) | School | District | State | School | District | State |
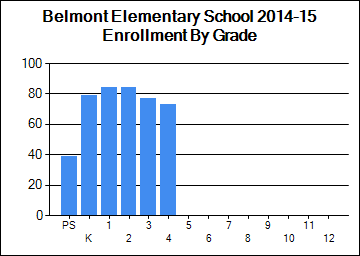
| PreSchool | 39 | 39 | 3,557 | | | |
| Kindergarten | 79 | 91 | 11,570 | | | |
| Readiness | 10 | 15 | 55 | | | |
| Grade 1 | 84 | 111 | 13,157 | 21 | 18 | 17 |
| Grade 2 | 84 | 104 | 13,408 | 21 | 21 | 18 |
| Grade 3 | 77 | 100 | 13,553 | 19 | 20 | 19 |
| Grade 4 | 73 | 88 | 13,558 | 18 | 18 | 19 |
| Grade 5 | 0 | 97 | 13,978 | 0 | 19 | 20 |
| Grade 6 | 0 | 98 | 13,960 | 0 | 20 | 21 |
| Grade 7 | 0 | 91 | 14,307 | 0 | 18 | 21 |
| Grade 8 | 0 | 97 | 14,343 | 0 | 19 | 22 |
| Grade 9 | 0 | 120 | 15,461 | | | |
| Grade 10 | 0 | 119 | 14,746 | | | |
| Grade 11 | 0 | 92 | 14,263 | | | |
| Grade 12 | 0 | 83 | 13,671 | | | |
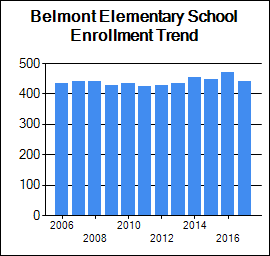
| Total Enrollment | 446 | 1,346 | 183,604 | | | |
|
|
| School Safety |
| | School | District | State |
| School Safety Incidences | 0 | 12 | 1,000 |
| Total Number of Incidents | 33 | 64 | 6,560 |
| No. of Incidents/1,000 students | 74 | 48 | 36 |
[View Safety Survey]
|
| Attendance/Four-Year Graduation Rate |
| | School | District | State |
| PreSchool Attendance Rate | | | 95.9 |
| Elem/Middle Attendance Rate (Target: 90%) | 95.7 | 95.7 | 95.2 |
| High School Four-Year Graduation Rate (Target: 90%) | | 83.7 | 88.1 |
[More Details]
|
|
| Teacher Quality |
| | School | District | State |
| N | % | N | % | N | % |
| Core Classes Taught by non-HQT | 98 | 66.7 | 147 | 30.0 | 3439 | 6.3 |
| Core Classes Taught by non-HQT in High-Poverty Schools | | N/A | | N/A | | 0.9 |
| Core Classes Taught by non-HQT in Low-Poverty Schools | | N/A | | 1.2 | | 2.1 |
| Employed Under Emergency Credentials | N/A | N/A | N/A | N/A | 2 | 0.02 |
| Bachelor's Degree | | N/C | | 46.3 | | 40.9 |
| Master's Degree | | N/C | | 52.8 | | 57.7 |
| Degree beyond Master's Degree | | N/C | | 0.9 | | 1.1 |
[More Details]
|
|
| School Staff |
| | School | District | State |
| Teachers | 31 | 109 | 14,726 |
| Instructional Support | 23 | 48 | 7,007 |
| Librarians | 1 | 3 | 318 |
| Specialists | 7 | 19 | 2,713 |
| Admin Support | 2 | 9 | 1,243 |
| All Other Support | 13 | 37 | 3,535 |
[More Details]
|
|
| State and Federal Accountability |
| New Hampshire School Adequacy Summary |
| Met Input-Based Accountability System (IBAS): |
N/A
|
| Met Performance-Based School Accountability System (PBAS): |
N/A
|
| Performance Score: |
N/A
|
| Provides Opportunity for an Adequate Education: |
N/A
|
|
|
N is the number of students participating.
% is the percent of students scoring proficient or above.
Click on a grade to show the achievement results for that grade. |
 |
| Grade | Content Area |
School |
State |
| N | % |
N | % |
| 3 | English Language Arts | 75 | 56 |
13,330 | 55 |
| Mathematics |
75 | 40 |
13,333 | 53 |
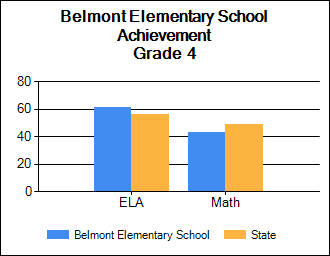
| 4 | English Language Arts | 69 | 61 |
13,195 | 56 |
| Mathematics |
69 | 43 |
13,300 | 49 |
|
|
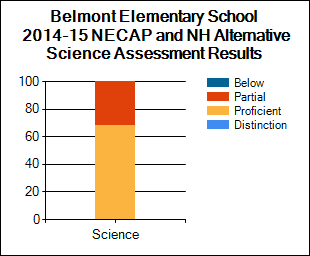
| NECAP and NH Alternative Assessment Science Results 2014-15 |
Student Assessment
* indicates total number of test takers is 10 or less.
Blank indicates no science assessment test administered.
|
| Achievement Level (%) | Science |
| School | District | State |
| Substantially Below Proficient (%) |
0
|
10
| 19 |
| Partially Proficient (%) |
32
|
38
| 46 |
| Proficient (%) |
68
|
51
| 34 |
| Proficient with Distinction (%) |
0
|
1
| 2 |
| Longitudinal Reports and Subgroup Reporting |
| Percent of students at each achievement level |
Math |
Reading |
Science |
|
|
|
|
| National Assessment of Educational Progress (NAEP) Student Achievement Data-Percent of NH Students At or Above Each Achievement Level (Based on the Winter 2013 NAEP Assessment) |
| NAEP achievement levels are indicated as follows: B+ for Basic or above, P+ for Proficient or above, and A for Advanced |
| Reading |
| Grade | B+ | P+ | A |
| 4 | 80 | 45 | 11 |
| 8 | 84 | 44 | 6 |
| Math |
| Grade | B+ | P+ | A |
| 4 | 93 | 59 | 12 |
| 8 | 84 | 47 | 13 |
|
|
|
|
|

