View State Profile
Return to Winchester District
Schools
Winchester School
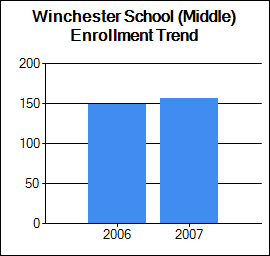
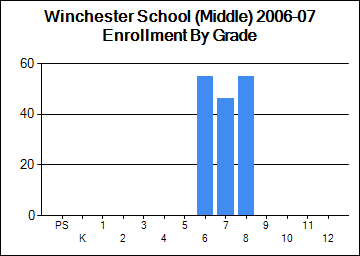
Winchester School (Middle)
|
School:Winchester School (Middle)
|
View: State Profile
Home |
Compare |
Glossary
Select a School Year:
|
|
|
| General Information |
 |
School: Winchester School (Middle) (26975) |
NCES School ID: 00111 |
| District: Winchester (573) |
NCES District ID: 3307140 |
| SAU: Monadnock Regional SAU Office (38) |
School Web Site: |
| : |
SAU Telephone: 603 352-6955 |
| Principal: Not Listed |
School Telephone: 603-239-4381 |
| Address: 85 Parker St., Winchester, NH 03470-2904 |
School Fax: 603-239-4457 |
| School Open Date:
| School Close Date:
6/30/2007 |
| School Type: Public School |
Grades Offered: 6-8 |
| Federal Accountability Status Met:
No |
NH Accountability Status Met: N/A |
| School Report Card 2006-07 |
| Enrollment |
| | October 1 Enrollment | Average Class Size |
| Grade(s) | School | District | State | School | District | State |
| PreSchool | 0 | 30 | 2,531 | | | |
| Kindergarten | 0 | 60 | 10,375 | | | |
| Readiness | 0 | 0 | 193 | | | |
| Grade 1 | 0 | 46 | 14,655 | 0 | 15 | 17 |
| Grade 2 | 0 | 53 | 14,618 | 0 | 18 | 18 |
| Grade 3 | 0 | 42 | 14,953 | 0 | 21 | 19 |
| Grade 4 | 0 | 41 | 15,080 | 0 | 20 | 20 |
| Grade 5 | 0 | 45 | 15,287 | 0 | 22 | 20 |
| Grade 6 | 55 | 55 | 15,770 | 18 | 18 | 21 |
| Grade 7 | 46 | 46 | 16,295 | 23 | 23 | 21 |
| Grade 8 | 55 | 55 | 16,431 | 18 | 18 | 21 |
| Grade 9 | 0 | 0 | 18,280 | | | |
| Grade 10 | 0 | 0 | 16,914 | | | |
| Grade 11 | 0 | 0 | 16,698 | | | |
| Grade 12 | 0 | 0 | 15,471 | | | |
| Total Enrollment | 156 | 473 | 203,572 | | | |
|
|
| School Safety |
| | School | District | State |
| School Safety Incidences | 5 | 10 | 2,415 |
| Total Number of Incidents | 58 | 116 | 30,723 |
| No. of Incidents/1,000 students | 372 | 245 | 151 |
[View Safety Survey]
|
| Attendance/Four-Year Graduation Rate |
| | School | District | State |
| PreSchool Attendance Rate | | | 88.9 |
| Elem/Middle Attendance Rate (Target: 90%) | 93.7 | 93.9 | 95.4 |
| High School Four-Year Graduation Rate (Target: 75%) | | | 87.4 |
[More Details]
|
|
| Teacher Quality |
| | School | District | State |
| N | % | N | % | N | % |
| Core Classes Taught by non-HQT | 0 | 0 | 0 | 0 | 423 | 1.3 |
| Core Classes Taught by non-HQT in High-Poverty Schools | | N/A | | N/A | | 0.2 |
| Core Classes Taught by non-HQT in Low-Poverty Schools | | N/A | | N/A | | 0.4 |
| Employed Under Emergency Credentials | N/A | N/A | N/A | N/A | 22 | 0.2 |
| Bachelor's Degree | | N/C | | 63.6 | | 51.2 |
| Master's Degree | | N/C | | 36.4 | | 47.3 |
| Degree beyond Master's Degree | | N/C | | 0 | | 1.2 |
[More Details]
|
|
| School Staff |
| | School | District | State |
| Teachers | 13 | 40 | 15,515 |
| Instructional Support | 10 | 31 | 6,772 |
| Librarians | 0 | 1 | 317 |
| Specialists | 2 | 9 | 2,576 |
| Admin Support | 1 | 3 | 1,263 |
| All Other Support | 6 | 14 | 3,718 |
[More Details]
|
|
| Improvement Status |
| Status for 2006-2007 School Year | Content Area | Met AYP Requirements | Status for 2007-2008 School Year |
| Acceptable | Reading | No | Acceptable |
| Acceptable | Math | No | Acceptable |
| Acceptable | Other | Yes | Acceptable |
| Statewide NCLB Accountability Status |
| | READING | MATHEMATICS |
| Schools | Districts | Schools | Districts |
| N | % | N | % | N | % | N | % |
| Acceptable | 370 | 78.9 | 142 | 87.6 | 383 | 81.7 | 145 | 89.6 |
| SINI/DINI Year 1 | 49 | 10.5 | 15 | 9.3 | 46 | 9.8 | 13 | 8.0 |
| SINI/DINI Year 2 | 31 | 6.6 | 4 | 2.5 | 27 | 5.7 | 2 | 1.2 |
| Corrective Action/Level 3 | 18 | 3.8 | 1 | 0.6 | 12 | 2.6 | 2 | 1.2 |
| Restructure Planning/Level 4 | 0 | 0.0 | 0 | 0.0 | 0 | 0 | 0 | 0.0 |
| Restructuring/Level 5 | 0 | 0.0 | 0 | 0.0 | 0 | 0 | 0 | 0.0 |
| State Total | 468 | 99.8 | 162 | 100.0 | 468 | 99.8 | 162 | 100.0 |
|
|
Student Assessment
* indicates total number of test takers is 10 or less.
Blank indicates no science assessment test administered.
|
| NECAP Longitudinal Reports |
| 1) NECAP Teaching Year District Tested at Grade Comparison |
Reading and Math |
| 2) NECAP Teaching Year District "Cohort" History Comparison |
Reading and Math |
| 3) NECAP Teaching Year District vs. State by Tested at Grade |
Math |
Reading |
| |
| 4) NECAP Teaching Year District vs. State by "Cohort" History |
Math |
Reading |
| |
| 5) NECAP Teaching Year District GAP Analysis by Tested at Grade |
Math |
Reading |
| |
| 6) NECAP and NH ALPs Teaching Year Average Index Score and GAP analysis |
Math |
Reading |
Science |
Writing |
| 7) NECAP and NH ALPs Teaching Year Percent of students at each index level |
Math |
Reading |
Science |
Writing |
| 8) NECAP and NH ALPs Teaching Year Median Student Growth Percentile (SGP) and GAP analysis |
Math |
Reading |
| |
| 9) NECAP and NH ALPs Teaching Year Percent of students at each Student Growth Percentile (SGP) Grouping |
Math |
Reading |
| |
|
|
|
|
| National Assessment of Educational Progress (NAEP) Student Achievement Data-Percent of NH Students At or Above Each Achievement Level (Based on the Winter 2005 NAEP Assessment) |
| NAEP achievement levels are indicated as follows: B+ for Basic or above, P+ for Proficient or above, and A for Advanced |
| Reading |
| Grade | B+ | P+ | A |
| 4 | 74 | 39 | 9 |
| 8 | 80 | 38 | 4 |
| Math |
| Grade | B+ | P+ | A |
| 4 | 89 | 47 | 6 |
| 8 | 77 | 35 | 7 |
|
|
|
|
|

