View State Profile
Change District:
Schools
Antrim Elementary School
Conval Regional High School
Dublin Consolidated School
Francestown Elementary School
Great Brook School
Greenfield Elementary School
Hancock Elementary School
Peterborough Elementary School
Pierce Elementary School
South Meadow School
Temple Elementary School
Career and Technical Education Centers
Region 14 Applied Technology Center
|
District:Contoocook Valley
|
View: State Profile
Home |
Compare |
Glossary
Select a School Year:
|
|
|
| General Information |
 |
District: Contoocook Valley
(112)
|
SAU: Contoocook Valley SAU Office (1) |
| Address: 106 Hancock Rd., Peterborough, NH 03458-1197 |
Telephone: 603-924-3336 |
| NCES District ID: 3302480 |
Fax: |
| Superintendent: Ann E Forrest |
Web Site: |
| |
| District Report Card 2016-17 |
| Enrollment |
| | October 1 Enrollment | Average Class Size |
| Grade(s) | District | State | District | State |
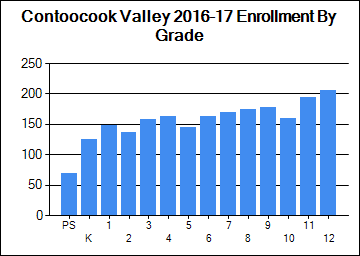
| PreSchool | 69 | 3,894 | | |
| Kindergarten | 125 | 11,422 | | |
| Readiness | 0 | 65 | | |
| Grade 1 | 148 | 12,378 | 13 | 17 |
| Grade 2 | 136 | 12,885 | 12 | 18 |
| Grade 3 | 158 | 13,309 | 14 | 19 |
| Grade 4 | 163 | 13,612 | 15 | 19 |
| Grade 5 | 145 | 13,718 | 0 | 20 |
| Grade 6 | 163 | 13,722 | 0 | 20 |
| Grade 7 | 169 | 14,102 | 0 | 21 |
| Grade 8 | 175 | 14,075 | 0 | 21 |
| Grade 9 | 177 | 15,139 | | |
| Grade 10 | 160 | 14,292 | | |
| Grade 11 | 194 | 13,785 | | |
| Grade 12 | 206 | 13,338 | | |
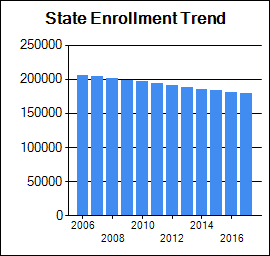
| Total Enrollment | 2188 | 179,737 | | |
|
|
| School Safety |
| | District | State |
| School Safety Incidences | 3 | 1,073 |
| Total Number of Incidents | 32 | 6,825 |
| No. of Incidents/1,000 students | 15 | 38 |
|
| Attendance/Four-Year Graduation Rate |
| | District | State |
| PreSchool Attendance Rate | | 89.8 |
| Elem/Middle Attendance Rate (Target: 90%) | 95 | 95.1 |
| High School Four-Year Graduation Rate (Target: 90%) | 89 | 89 |
[More Details]
|
|
|
|
| School Staff |
| | District | State |
| Teachers | 196 | 14,758 |
| Instructional Support | 81 | 6,980 |
| Librarians | 6 | 324 |
| Specialists | 38 | 2,772 |
| Admin Support | 18 | 1,247 |
| All Other Support | 30 | 3,241 |
[More Details]
|
|
| State and Federal Accountability |
|
|
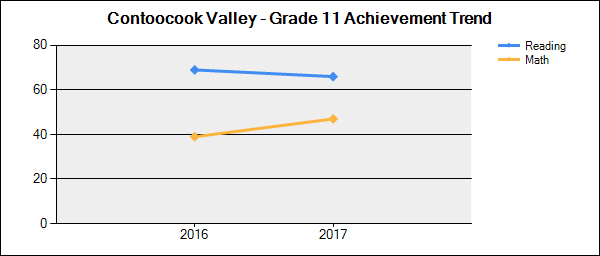
Student Achievement Trends
N is the number of students participating.
% is the percent of students scoring proficient or above.
Click on a grade to show the achievement trend for that grade.
Note: Grade 11 results are from the new SAT assessment tests and not comparable to 2014-2015 |
 |
| Grade | Content Area | 2015-2016 | 2016-2017 |
| N | % | N | % |
| 3 | Reading |
155 | 54 | 150 | 38 | | Mathematics |
158 | 46 | 150 | 35 | | 4 | Reading |
130 | 56 | 159 | 48 | | Mathematics |
130 | 39 | 158 | 40 | | 5 | Reading |
152 | 64 | 138 | 59 | | Mathematics |
151 | 33 | 137 | 30 | | 6 | Reading |
161 | 55 | 159 | 53 | | Mathematics |
161 | 34 | 159 | 36 | | 7 | Reading |
160 | 55 | 154 | 58 | | Mathematics |
160 | 36 | 153 | 41 | | 8 | Reading |
160 | 64 | 162 | 47 | | Mathematics |
160 | 48 | 159 | 39 | | 11 | Reading |
178 | 69 | 176 | 66 | | Mathematics |
178 | 39 | 176 | 47 |
|
|
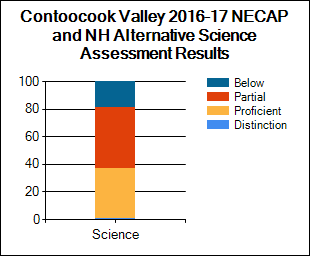
| NECAP and NH Alternative Assessment Science Results 2016-17 |
Student Assessment
* indicates total number of test takers is 10 or less.
Blank indicates no science assessment test administered.
|
| Achievement Level (%) | Science |
| District | State |
| Substantially Below Proficient (%) |
19
| 18 |
| Partially Proficient (%) |
45
| 46 |
| Proficient (%) |
36
| 35 |
| Proficient with Distinction (%) |
1
| 2 |
| Longitudinal Reports and Subgroup Reporting |
| Percent of students at each achievement level |
Math |
Reading |
Science |
|
|
|
| National Assessment of Educational Progress (NAEP) Student Achievement Data-Percent of NH Students At or Above Each Achievement Level (Based on the Winter 2015 NAEP Assessment) |
| NAEP achievement levels are indicated as follows: B+ for Basic or above, P+ for Proficient or above, and A for Advanced |
| Reading |
| Grade | B+ | P+ | A |
| 4 | 79 | 46 | 12 |
| 8 | 85 | 45 | 5 |
| Math |
| Grade | B+ | P+ | A |
| 4 | 91 | 51 | 10 |
| 8 | 84 | 46 | 12 |
|
|
|
|
|
New Hampshire Department of Education
101 Pleasant Street | Concord, NH | 03301-3494
Telephone: (603) 271-3494 | TDD Access: Relay NH 711
|
