View State Profile
Change District:
Schools
Alvirne High School
Dr. H. O. Smith Elementary School
Hills Garrison Elementary School
Hudson Memorial School
Nottingham West Elementary School
Career and Technical Education Centers
Wilbur H. Palmer Career & Tech Ed Ctr
|
District:Hudson
|
View: State Profile
Home |
Compare |
Glossary
Select a School Year:
|
|
|
| General Information |
 |
District: Hudson
(267)
|
SAU: Hudson SAU Office (81) |
| Address: 20 Library St., Hudson, NH 03051-4240 |
Telephone: 603-886-1235 |
| NCES District ID: 3303930 |
Fax: 603-886-1236 |
| Superintendent: Daniel Moulis |
Web Site: |
| |
| District Report Card 2016-17 |
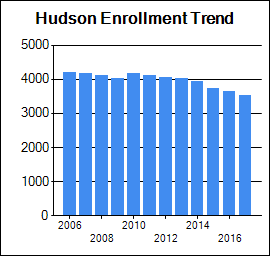
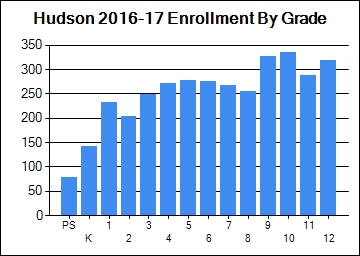
| Enrollment |
| | October 1 Enrollment | Average Class Size |
| Grade(s) | District | State | District | State |
| PreSchool | 78 | 3,894 | | |
| Kindergarten | 141 | 11,422 | | |
| Readiness | 0 | 65 | | |
| Grade 1 | 233 | 12,378 | 19 | 17 |
| Grade 2 | 203 | 12,885 | 18 | 18 |
| Grade 3 | 249 | 13,309 | 21 | 19 |
| Grade 4 | 272 | 13,612 | 25 | 19 |
| Grade 5 | 278 | 13,718 | 23 | 20 |
| Grade 6 | 275 | 13,722 | 0 | 20 |
| Grade 7 | 267 | 14,102 | 0 | 21 |
| Grade 8 | 255 | 14,075 | 0 | 21 |
| Grade 9 | 326 | 15,139 | | |
| Grade 10 | 336 | 14,292 | | |
| Grade 11 | 287 | 13,785 | | |
| Grade 12 | 318 | 13,338 | | |
| Total Enrollment | 3518 | 179,737 | | |
|
|
| School Safety |
| | District | State |
| School Safety Incidences | 24 | 1,073 |
| Total Number of Incidents | 130 | 6,825 |
| No. of Incidents/1,000 students | 37 | 38 |
|
| Attendance/Four-Year Graduation Rate |
| | District | State |
| PreSchool Attendance Rate | | 89.8 |
| Elem/Middle Attendance Rate (Target: 90%) | 95.8 | 95.1 |
| High School Four-Year Graduation Rate (Target: 90%) | 89 | 89 |
[More Details]
|
|
|
|
| School Staff |
| | District | State |
| Teachers | 251 | 14,758 |
| Instructional Support | 96 | 6,980 |
| Librarians | 4 | 324 |
| Specialists | 36 | 2,772 |
| Admin Support | 23 | 1,247 |
| All Other Support | 50 | 3,241 |
[More Details]
|
|
| State and Federal Accountability |
|
|
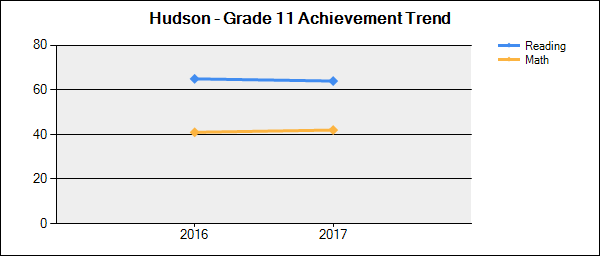
Student Achievement Trends
N is the number of students participating.
% is the percent of students scoring proficient or above.
Click on a grade to show the achievement trend for that grade.
Note: Grade 11 results are from the new SAT assessment tests and not comparable to 2014-2015 |
 |
| Grade | Content Area | 2015-2016 | 2016-2017 |
| N | % | N | % |
| 3 | Reading |
256 | 58 | 238 | 54 | | Mathematics |
259 | 60 | 238 | 55 | | 4 | Reading |
269 | 63 | 259 | 56 | | Mathematics |
270 | 55 | 259 | 49 | | 5 | Reading |
270 | 69 | 270 | 57 | | Mathematics |
271 | 52 | 270 | 44 | | 6 | Reading |
264 | 59 | 265 | 61 | | Mathematics |
264 | 48 | 264 | 54 | | 7 | Reading |
249 | 59 | 262 | 61 | | Mathematics |
250 | 48 | 263 | 43 | | 8 | Reading |
292 | 62 | 244 | 58 | | Mathematics |
291 | 33 | 244 | 38 | | 11 | Reading |
319 | 65 | 259 | 64 | | Mathematics |
320 | 41 | 259 | 42 |
|
|
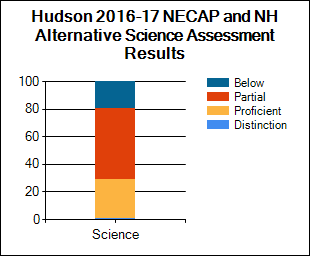
| NECAP and NH Alternative Assessment Science Results 2016-17 |
Student Assessment
* indicates total number of test takers is 10 or less.
Blank indicates no science assessment test administered.
|
| Achievement Level (%) | Science |
| District | State |
| Substantially Below Proficient (%) |
20
| 18 |
| Partially Proficient (%) |
52
| 46 |
| Proficient (%) |
28
| 35 |
| Proficient with Distinction (%) |
1
| 2 |
| Longitudinal Reports and Subgroup Reporting |
| Percent of students at each achievement level |
Math |
Reading |
Science |
|
|
|
| National Assessment of Educational Progress (NAEP) Student Achievement Data-Percent of NH Students At or Above Each Achievement Level (Based on the Winter 2015 NAEP Assessment) |
| NAEP achievement levels are indicated as follows: B+ for Basic or above, P+ for Proficient or above, and A for Advanced |
| Reading |
| Grade | B+ | P+ | A |
| 4 | 79 | 46 | 12 |
| 8 | 85 | 45 | 5 |
| Math |
| Grade | B+ | P+ | A |
| 4 | 91 | 51 | 10 |
| 8 | 84 | 46 | 12 |
|
|
|
|
|
New Hampshire Department of Education
101 Pleasant Street | Concord, NH | 03301-3494
Telephone: (603) 271-3494 | TDD Access: Relay NH 711
|
