View State Profile
Return to Newfound Area District
Schools
Alexandria Village School
Bridgewater-Hebron Village School
Bristol Elementary School
Danbury Elementary School
New Hampton Community School
Newfound Memorial Middle School
Newfound Regional High School
|
School:Danbury Elementary School
|
View: State Profile
Home |
Compare |
Glossary
Select a School Year:
|
|
|
| General Information |
 |
School: Danbury Elementary School (20095) |
NCES School ID: 00334 |
| District: Newfound Area (388) |
NCES District ID: 3305220 |
| SAU: Newfound Area SAU Office (4) |
School Web Site: http://des.sau4.org/ |
| Superintendent: Paul Hoiriis |
SAU Telephone: 603-744-5555 |
| Admin Principal: Jessica Pine |
School Telephone: 603-768-3434 |
| Address: 20 Daffodil Ln., Danbury, NH 03230-4230 |
School Fax: 603-768-9802 |
| School Open Date:
| School Close Date:
|
| School Type: Public School |
Grades Offered: K 1-5 |
| Federal Accountability Status Met:
No |
NH Accountability Status Met: N/A |
| School Report Card 2007-08 |
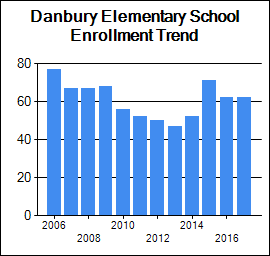
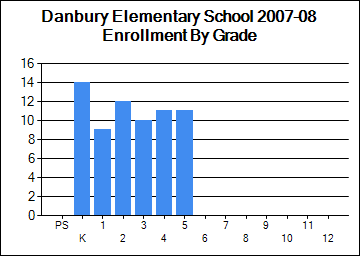
| Enrollment |
| | October 1 Enrollment | Average Class Size |
| Grade(s) | School | District | State | School | District | State |
| PreSchool | 0 | 15 | 2,614 | | | |
| Kindergarten | 14 | 106 | 10,489 | | | |
| Readiness | 0 | 0 | 261 | | | |
| Grade 1 | 9 | 92 | 14,364 | 9 | 12 | 17 |
| Grade 2 | 12 | 88 | 14,436 | 12 | 15 | 18 |
| Grade 3 | 10 | 95 | 14,624 | 10 | 14 | 18 |
| Grade 4 | 11 | 98 | 15,026 | 11 | 16 | 20 |
| Grade 5 | 11 | 96 | 15,203 | 11 | 16 | 21 |
| Grade 6 | 0 | 118 | 15,318 | 0 | 13 | 20 |
| Grade 7 | 0 | 120 | 15,806 | 0 | 13 | 20 |
| Grade 8 | 0 | 134 | 16,218 | 0 | 15 | 21 |
| Grade 9 | 0 | 136 | 17,532 | | | |
| Grade 10 | 0 | 120 | 16,922 | | | |
| Grade 11 | 0 | 100 | 16,000 | | | |
| Grade 12 | 0 | 109 | 15,918 | | | |
| Total Enrollment | 67 | 1,427 | 200,772 | | | |
|
|
| School Safety |
| | School | District | State |
| School Safety Incidences | 0 | 1 | 2,512 |
| Total Number of Incidents | 0 | 263 | 31,578 |
| No. of Incidents/1,000 students | 0 | 184 | 157 |
[View Safety Survey]
|
| Attendance/Four-Year Graduation Rate |
| | School | District | State |
| PreSchool Attendance Rate | | | 89.9 |
| Elem/Middle Attendance Rate (Target: 90%) | 95.3 | 94.8 | 95.3 |
| High School Four-Year Graduation Rate (Target: 75%) | | 89.4 | 87.9 |
[More Details]
|
|
| Teacher Quality |
| | School | District | State |
| N | % | N | % | N | % |
| Core Classes Taught by non-HQT | 0 | 0 | 0 | 0 | 323 | 0.9 |
| Core Classes Taught by non-HQT in High-Poverty Schools | | N/A | | N/A | | 0.2 |
| Core Classes Taught by non-HQT in Low-Poverty Schools | | N/A | | N/A | | 0.2 |
| Employed Under Emergency Credentials | N/A | N/A | 1 | 6.2 | 28 | 0.2 |
| Bachelor's Degree | | N/C | | 68.3 | | 50.5 |
| Master's Degree | | N/C | | 30.9 | | 48.3 |
| Degree beyond Master's Degree | | N/C | | 0 | | 0.9 |
[More Details]
|
|
| School Staff |
| | School | District | State |
| Teachers | 8 | 126 | 15,484 |
| Instructional Support | 6 | 65 | 6,877 |
| Librarians | 0 | 5 | 323 |
| Specialists | 3 | 31 | 2,644 |
| Admin Support | 1 | 14 | 1,296 |
| All Other Support | 2 | 38 | 3,789 |
[More Details]
|
|
| Improvement Status |
| Status for 2007-2008 School Year | Content Area | Met AYP Requirements | Status for 2008-2009 School Year |
| Acceptable | Reading | No | Acceptable |
| Acceptable | Math | No | Acceptable |
| Acceptable | Other | Yes | Acceptable |
| Statewide NCLB Accountability Status |
| | READING | MATHEMATICS |
| Schools | Districts | Schools | Districts |
| N | % | N | % | N | % | N | % |
| Acceptable | 345 | 72.5 | 137 | 85.1 | 346 | 72.7 | 141 | 87.0 |
| SINI/DINI Year 1 | 58 | 12.2 | 16 | 9.9 | 63 | 13.2 | 8 | 4.9 |
| SINI/DINI Year 2 | 36 | 7.6 | 5 | 3.1 | 33 | 6.9 | 9 | 5.6 |
| Corrective Action/Level 3 | 24 | 5.0 | 3 | 1.9 | 24 | 5 | 3 | 1.9 |
| Restructure Planning/Level 4 | 13 | 2.7 | 0 | 0.0 | 10 | 2.1 | 0 | 0.0 |
| Restructuring/Level 5 | 0 | 0.0 | 0 | 0.0 | 0 | 0 | 0 | 0.0 |
| State Total | 476 | 100.0 | 161 | 100.0 | 476 | 100 | 161 | 100.0 |
|
|
Student Assessment
* indicates total number of test takers is 10 or less.
Blank indicates no science assessment test administered.
|
| NECAP Longitudinal Reports |
| 1) NECAP Teaching Year District Tested at Grade Comparison |
Reading and Math |
| 2) NECAP Teaching Year District "Cohort" History Comparison |
Reading and Math |
| 3) NECAP Teaching Year District vs. State by Tested at Grade |
Math |
Reading |
| |
| 4) NECAP Teaching Year District vs. State by "Cohort" History |
Math |
Reading |
| |
| 5) NECAP Teaching Year District GAP Analysis by Tested at Grade |
Math |
Reading |
| |
| 6) NECAP and NH ALPs Teaching Year Average Index Score and GAP analysis |
Math |
Reading |
Science |
Writing |
| 7) NECAP and NH ALPs Teaching Year Percent of students at each index level |
Math |
Reading |
Science |
Writing |
| 8) NECAP and NH ALPs Teaching Year Median Student Growth Percentile (SGP) and GAP analysis |
Math |
Reading |
| |
| 9) NECAP and NH ALPs Teaching Year Percent of students at each Student Growth Percentile (SGP) Grouping |
Math |
Reading |
| |
|
|
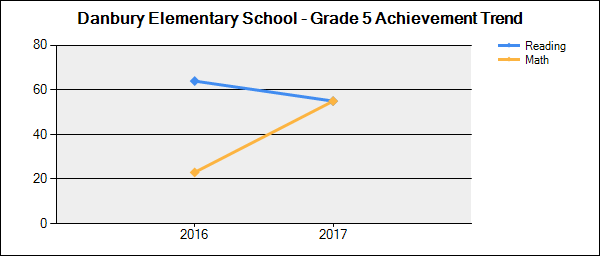
Student Achievement Trends
N is the number of students participating.
% is the percent of students scoring proficient or above.
Click on a grade to show the achievement trend for that grade. |
 |
| Grade | Content Area | 2009-2010 | 2010-2011 | 2011-2012 | 2012-2013 | 2013-2014 |
| N | % | N | % | N | % | N | % | N | % |
| 3 | Reading | 10 | 70 | 13 | 62 | 10 | 90 | 5 | 0 | 10 | 90 |
| Mathematics | 10 | 60 | 13 | 77 | 10 | 80 | 5 | | 10 | 100 |
| 4 | Reading | 10 | 80 | 9 | 0 | 9 | 0 | 10 | 90 | 8 | 0 |
| Mathematics | 10 | 80 | 9 | | 9 | | 10 | 90 | 8 | |
| 5 | Reading | | | | | | | | | 10 | 90 |
| Mathematics | | | | | | | | | 10 | 90 |
| Writing | | | | | | | | | 10 | 80 |
|
|
| National Assessment of Educational Progress (NAEP) Student Achievement Data-Percent of NH Students At or Above Each Achievement Level (Based on the Winter 2007 NAEP Assessment) |
| NAEP achievement levels are indicated as follows: B+ for Basic or above, P+ for Proficient or above, and A for Advanced |
| Reading |
| Grade | B+ | P+ | A |
| 4 | 76 | 41 | 11 |
| 8 | 82 | 37 | 3 |
| Math |
| Grade | B+ | P+ | A |
| 4 | 91 | 52 | 7 |
| 8 | 78 | 38 | 8 |
|
|
|
|
|

