View State Profile
Return to Hooksett District
Schools
David R. Cawley Middle School
Fred C. Underhill School
Hooksett Memorial School
|
School:Fred C. Underhill School
|
View: State Profile
Home |
Compare |
Glossary
Select a School Year:
|
|
|
| General Information |
 |
School: Fred C. Underhill School (20550) |
NCES School ID: 00173 |
| District: Hooksett (261) |
NCES District ID: 3303870 |
| SAU: Hooksett SAU Office (15) |
School Web Site: www.underhill.sau15.net |
| Superintendent: William Rearick |
SAU Telephone: 603-622-3731 |
| Admin Principal: Benjamin Loi |
School Telephone: 603-623-7233 |
| Address: 2 Sherwood Dr., Hooksett, NH 03106-1092 |
School Fax: 603-623-5896 |
| School Open Date:
| School Close Date:
|
| School Type: Public School |
Grades Offered: P K 1-2 |
| Federal Accountability Status:
None Assigned |
NH Adequacy Status Met: N/A |
| School Report Card 2016-17 |
| Enrollment |
| | October 1 Enrollment | Average Class Size |
| Grade(s) | School | District | State | School | District | State |
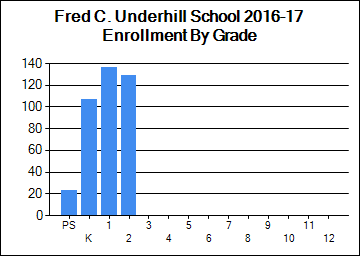
| PreSchool | 23 | 23 | 3,894 | | | |
| Kindergarten | 107 | 107 | 11,422 | | | |
| Readiness | 0 | 0 | 65 | | | |
| Grade 1 | 136 | 136 | 12,378 | 17 | 17 | 17 |
| Grade 2 | 129 | 129 | 12,885 | 18 | 18 | 18 |
| Grade 3 | 0 | 139 | 13,309 | 0 | 20 | 19 |
| Grade 4 | 0 | 147 | 13,612 | 0 | 21 | 19 |
| Grade 5 | 0 | 163 | 13,718 | 0 | 20 | 20 |
| Grade 6 | 0 | 171 | 13,722 | 0 | 21 | 20 |
| Grade 7 | 0 | 154 | 14,102 | 0 | 19 | 21 |
| Grade 8 | 0 | 153 | 14,075 | 0 | 19 | 21 |
| Grade 9 | 0 | 0 | 15,139 | | | |
| Grade 10 | 0 | 0 | 14,292 | | | |
| Grade 11 | 0 | 0 | 13,785 | | | |
| Grade 12 | 0 | 0 | 13,338 | | | |
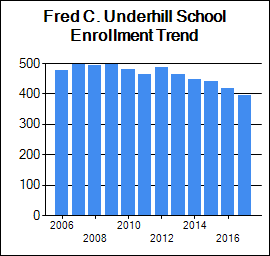
| Total Enrollment | 395 | 1,322 | 179,737 | | | |
|
|
| School Safety |
| | School | District | State |
| School Safety Incidences | 0 | 3 | 1,073 |
| Total Number of Incidents | 1 | 17 | 6,825 |
| No. of Incidents/1,000 students | 3 | 13 | 38 |
[View Safety Survey]
|
| Attendance/Four-Year Graduation Rate |
| | School | District | State |
| PreSchool Attendance Rate | | | 89.8 |
| Elem/Middle Attendance Rate (Target: 90%) | 95.4 | 95.5 | 95.1 |
| High School Four-Year Graduation Rate (Target: 90%) | | 100 | 89 |
[More Details]
|
|
|
|
| School Staff |
| | School | District | State |
| Teachers | 26 | 97 | 14,758 |
| Instructional Support | 16 | 32 | 6,980 |
| Librarians | 1 | 3 | 324 |
| Specialists | 5 | 20 | 2,772 |
| Admin Support | 3 | 6 | 1,247 |
| All Other Support | 10 | 25 | 3,241 |
[More Details]
|
|
| State and Federal Accountability |
|
|
|
|
| NECAP and NH Alternative Assessment Science Results 2016-17 |
Student Assessment
* indicates total number of test takers is 10 or less.
Blank indicates no science assessment test administered.
|
|
|
|
|
| National Assessment of Educational Progress (NAEP) Student Achievement Data-Percent of NH Students At or Above Each Achievement Level (Based on the Winter 2015 NAEP Assessment) |
| NAEP achievement levels are indicated as follows: B+ for Basic or above, P+ for Proficient or above, and A for Advanced |
| Reading |
| Grade | B+ | P+ | A |
| 4 | 79 | 46 | 12 |
| 8 | 85 | 45 | 5 |
| Math |
| Grade | B+ | P+ | A |
| 4 | 91 | 51 | 10 |
| 8 | 84 | 46 | 12 |
|
|
|
|
|

