View State Profile
Return to Manchester District
Schools
Bakersville School
Beech Street School
Gossler Park School
Green Acres School
Hallsville School
Henry J. McLaughlin Jr. Middle School
Henry Wilson Elementary School
Highland-Goffes Falls School
Hillside Middle School
Jewett School
Manchester Central High School
Manchester Memorial High School
Manchester West High School
McDonough School
Middle School At Parkside
Northwest Elementary School
Parker-Varney School
Selma Deitch Early Learning Program
Smyth Road School
Southside Middle School
Webster School
Weston Elementary School
|
School:Weston Elementary School
|
View: State Profile
Home |
Compare |
Glossary
Select a School Year:
|
|
|
| General Information |
 |
School: Weston Elementary School (21515) |
NCES School ID: 00262 |
| District: Manchester (335) |
NCES District ID: 3304590 |
| SAU: Manchester SAU Office (37) |
School Web Site: weston.mansd.org |
| Interim Superintendent: Jennifer Gillis |
SAU Telephone: 603-624-6300 |
| Admin Principal: Shawn Baskerville |
School Telephone: 603-624-6347 |
| Address: 7 Michigan Avenue, Manchester, NH 03104-5598 |
School Fax: 603-624-6375 |
| School Open Date:
| School Close Date:
|
| School Type: Public School |
Grades Offered: P K 1-5 |
| Federal Accountability Status Met:
No |
NH Accountability Status Met: N/A |
| School Report Card 2008-09 |
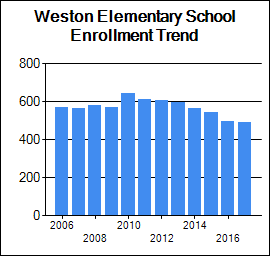
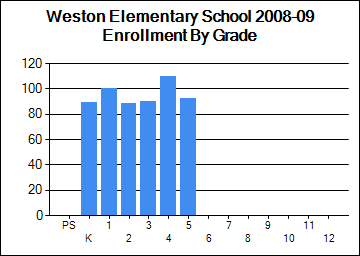
| Enrollment |
| | October 1 Enrollment | Average Class Size |
| Grade(s) | School | District | State | School | District | State |
| PreSchool | 0 | 280 | 2,834 | | | |
| Kindergarten | 89 | 911 | 10,968 | | | |
| Readiness | 0 | 27 | 235 | | | |
| Grade 1 | 100 | 1,168 | 14,209 | 20 | 18 | 17 |
| Grade 2 | 88 | 1,078 | 14,239 | 18 | 18 | 18 |
| Grade 3 | 90 | 1,086 | 14,475 | 18 | 19 | 19 |
| Grade 4 | 110 | 1,064 | 14,613 | 28 | 20 | 19 |
| Grade 5 | 92 | 1,131 | 15,013 | 23 | 23 | 21 |
| Grade 6 | 0 | 1,142 | 15,174 | 0 | 24 | 21 |
| Grade 7 | 0 | 1,121 | 15,452 | 0 | 25 | 21 |
| Grade 8 | 0 | 1,073 | 15,783 | 0 | 24 | 22 |
| Grade 9 | 0 | 1,812 | 17,244 | | | |
| Grade 10 | 0 | 1,303 | 16,260 | | | |
| Grade 11 | 0 | 1,326 | 16,016 | | | |
| Grade 12 | 0 | 1,466 | 15,419 | | | |
| Total Enrollment | 569 | 15,992 | 197,956 | | | |
|
|
| School Safety |
| | School | District | State |
| School Safety Incidences | 0 | 159 | 2,282 |
| Total Number of Incidents | 41 | 4,890 | 31,773 |
| No. of Incidents/1,000 students | 72 | 306 | 161 |
[View Safety Survey]
|
| Attendance/Four-Year Graduation Rate |
| | School | District | State |
| PreSchool Attendance Rate | | 87.5 | 90.6 |
| Elem/Middle Attendance Rate (Target: 90%) | 95.7 | 93.3 | 95.3 |
| High School Four-Year Graduation Rate (Target: 75%) | | 84 | 90.2 |
[More Details]
|
|
| Teacher Quality |
| | School | District | State |
| N | % | N | % | N | % |
| Core Classes Taught by non-HQT | 0 | 0 | 5 | 0.2 | 237 | 0.7 |
| Core Classes Taught by non-HQT in High-Poverty Schools | | N/A | | N/A | | 0.1 |
| Core Classes Taught by non-HQT in Low-Poverty Schools | | N/A | | N/A | | 0.2 |
| Employed Under Emergency Credentials | N/A | N/A | 3 | 2.5 | 33 | 0.3 |
| Bachelor's Degree | | N/C | | 59.9 | | 48.6 |
| Master's Degree | | N/C | | 39.5 | | 50.2 |
| Degree beyond Master's Degree | | N/C | | 0.6 | | 0.8 |
[More Details]
|
|
| School Staff |
| | School | District | State |
| Teachers | 37 | 1,131 | 15,660 |
| Instructional Support | 13 | 340 | 7,095 |
| Librarians | 1 | 24 | 324 |
| Specialists | 6 | 194 | 2,545 |
| Admin Support | 1 | 49 | 1,283 |
| All Other Support | 3 | 162 | 3,751 |
[More Details]
|
|
| Improvement Status |
| Status for 2008-2009 School Year | Content Area | Met AYP Requirements | Status for 2009-2010 School Year |
| SINI Year 1 | Reading | No | SINI Year 2 |
| SINI Year 1 | Math | No | SINI Year 2 |
| Acceptable | Other | Yes | Acceptable |
| Statewide NCLB Accountability Status |
| | READING | MATHEMATICS |
| Schools | Districts | Schools | Districts |
| N | % | N | % | N | % | N | % |
| Acceptable | 310 | 65.0 | 137 | 84.6 | 280 | 58.7 | 117 | 72.2 |
| SINI/DINI Year 1 | 67 | 14.0 | 10 | 6.2 | 103 | 21.6 | 29 | 17.9 |
| SINI/DINI Year 2 | 45 | 9.4 | 12 | 7.4 | 36 | 7.5 | 6 | 3.7 |
| Corrective Action/Level 3 | 28 | 5.9 | 3 | 1.9 | 32 | 6.7 | 10 | 6.2 |
| Restructure Planning/Level 4 | 19 | 4.0 | 0 | 0.0 | 20 | 4.2 | 0 | 0.0 |
| Restructuring/Level 5 | 8 | 1.7 | 0 | 0.0 | 6 | 1.3 | 0 | 0.0 |
| State Total | 477 | 100.0 | 162 | 100.0 | 477 | 100 | 162 | 100.0 |
|
|
Student Assessment
* indicates total number of test takers is 10 or less.
Blank indicates no science assessment test administered.
|
| NECAP Longitudinal Reports |
| 1) NECAP Teaching Year District Tested at Grade Comparison |
Reading and Math |
| 2) NECAP Teaching Year District "Cohort" History Comparison |
Reading and Math |
| 3) NECAP Teaching Year District vs. State by Tested at Grade |
Math |
Reading |
| |
| 4) NECAP Teaching Year District vs. State by "Cohort" History |
Math |
Reading |
| |
| 5) NECAP Teaching Year District GAP Analysis by Tested at Grade |
Math |
Reading |
| |
| 6) NECAP and NH ALPs Teaching Year Average Index Score and GAP analysis |
Math |
Reading |
Science |
Writing |
| 7) NECAP and NH ALPs Teaching Year Percent of students at each index level |
Math |
Reading |
Science |
Writing |
| 8) NECAP and NH ALPs Teaching Year Median Student Growth Percentile (SGP) and GAP analysis |
Math |
Reading |
| |
| 9) NECAP and NH ALPs Teaching Year Percent of students at each Student Growth Percentile (SGP) Grouping |
Math |
Reading |
| |
|
|
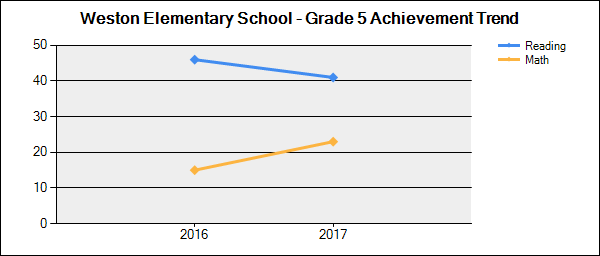
Student Achievement Trends
N is the number of students participating.
% is the percent of students scoring proficient or above.
Click on a grade to show the achievement trend for that grade. |
 |
| Grade | Content Area | 2009-2010 | 2010-2011 | 2011-2012 | 2012-2013 | 2013-2014 |
| N | % | N | % | N | % | N | % | N | % |
| 3 | Reading | 94 | 67 | 101 | 74 | 97 | 55 | 117 | 71 | 76 | 63 |
| Mathematics | 94 | 59 | 101 | 65 | 97 | 56 | 117 | 60 | 76 | 53 |
| 4 | Reading | 92 | 60 | 89 | 65 | 102 | 75 | 81 | 62 | 110 | 75 |
| Mathematics | 93 | 55 | 89 | 64 | 103 | 68 | 81 | 67 | 110 | 70 |
| 5 | Reading | 119 | 82 | 84 | 60 | 91 | 66 | 96 | 77 | 76 | 61 |
| Mathematics | 119 | 77 | 84 | 49 | 91 | 64 | 97 | 70 | 76 | 54 |
| Writing | 0 | | 84 | 32 | 91 | 54 | 96 | 46 | 76 | 39 |
|
|
| National Assessment of Educational Progress (NAEP) Student Achievement Data-Percent of NH Students At or Above Each Achievement Level (Based on the Winter 2007 NAEP Assessment) |
| NAEP achievement levels are indicated as follows: B+ for Basic or above, P+ for Proficient or above, and A for Advanced |
| Reading |
| Grade | B+ | P+ | A |
| 4 | 76 | 41 | 11 |
| 8 | 82 | 37 | 3 |
| Math |
| Grade | B+ | P+ | A |
| 4 | 91 | 52 | 7 |
| 8 | 78 | 38 | 8 |
|
|
|
|
|

