View State Profile
Return to Wakefield District
Schools
Paul Elementary School
Union Elementary School
|
School:Paul Elementary School
|
View: State Profile
Home |
Compare |
Glossary
Select a School Year:
|
|
|
| General Information |
 |
School: Paul Elementary School (22110) |
NCES School ID: 00442 |
| District: Wakefield (543) |
NCES District ID: 3306780 |
| SAU: Wakefield SAU Office (101) |
School Web Site: sau64.org/paul-school |
| Superintendent: Anne Kebler |
SAU Telephone: 603-871-8502 |
| Admin Principal: Kristen White |
School Telephone: 603-522-8891 |
| Address: 60 Taylor Way, Sanbornville, NH 03872-4350 |
School Fax: 603-522-6143 |
| School Open Date:
| School Close Date:
|
| School Type: Public School |
Grades Offered: P K 1-8 |
| Federal Accountability Status Met:
Yes |
NH Accountability Status Met: N/A |
| School Report Card 2008-09 |
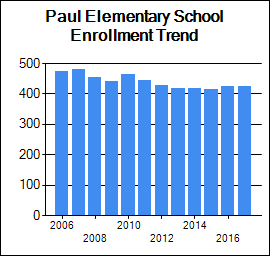
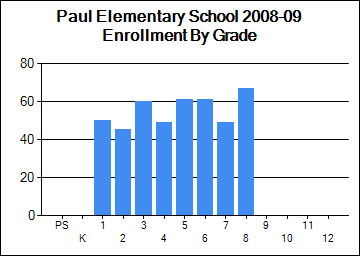
| Enrollment |
| | October 1 Enrollment | Average Class Size |
| Grade(s) | School | District | State | School | District | State |
| PreSchool | 0 | 0 | 2,834 | | | |
| Kindergarten | 0 | 48 | 10,968 | | | |
| Readiness | 0 | 0 | 235 | | | |
| Grade 1 | 50 | 50 | 14,209 | 17 | 17 | 17 |
| Grade 2 | 45 | 45 | 14,239 | 15 | 15 | 18 |
| Grade 3 | 60 | 60 | 14,475 | 20 | 20 | 19 |
| Grade 4 | 49 | 49 | 14,613 | 16 | 16 | 19 |
| Grade 5 | 61 | 61 | 15,013 | 20 | 20 | 21 |
| Grade 6 | 61 | 61 | 15,174 | 20 | 20 | 21 |
| Grade 7 | 49 | 49 | 15,452 | 16 | 16 | 21 |
| Grade 8 | 67 | 67 | 15,783 | 22 | 22 | 22 |
| Grade 9 | 0 | 0 | 17,244 | | | |
| Grade 10 | 0 | 0 | 16,260 | | | |
| Grade 11 | 0 | 0 | 16,016 | | | |
| Grade 12 | 0 | 0 | 15,419 | | | |
| Total Enrollment | 442 | 490 | 197,956 | | | |
|
|
| School Safety |
| | School | District | State |
| School Safety Incidences | 3 | 3 | 2,282 |
| Total Number of Incidents | 130 | 130 | 31,773 |
| No. of Incidents/1,000 students | 294 | 265 | 161 |
[View Safety Survey]
|
| Attendance/Four-Year Graduation Rate |
| | School | District | State |
| PreSchool Attendance Rate | | | 90.6 |
| Elem/Middle Attendance Rate (Target: 90%) | 94.1 | 94.1 | 95.3 |
| High School Four-Year Graduation Rate (Target: 75%) | | | 90.2 |
[More Details]
|
|
| Teacher Quality |
| | School | District | State |
| N | % | N | % | N | % |
| Core Classes Taught by non-HQT | 0 | 0 | 0 | 0 | 237 | 0.7 |
| Core Classes Taught by non-HQT in High-Poverty Schools | | N/A | | N/A | | 0.1 |
| Core Classes Taught by non-HQT in Low-Poverty Schools | | N/A | | N/A | | 0.2 |
| Employed Under Emergency Credentials | N/A | N/A | N/A | N/A | 33 | 0.3 |
| Bachelor's Degree | | N/C | | 70.3 | | 48.6 |
| Master's Degree | | N/C | | 29.7 | | 50.2 |
| Degree beyond Master's Degree | | N/C | | 0 | | 0.8 |
[More Details]
|
|
| School Staff |
| | School | District | State |
| Teachers | 35 | 37 | 15,660 |
| Instructional Support | 25 | 27 | 7,095 |
| Librarians | 1 | 1 | 324 |
| Specialists | 5 | 5 | 2,545 |
| Admin Support | 2 | 2 | 1,283 |
| All Other Support | 16 | 16 | 3,751 |
[More Details]
|
|
| Improvement Status |
| Status for 2008-2009 School Year | Content Area | Met AYP Requirements | Status for 2009-2010 School Year |
| SINI Year 1 | Reading | Yes | SINI Year 1 |
| Restructure Planning/Level 4 | Math | Yes | Restructure Planning/Level 4 |
| Acceptable | Other | Yes | Acceptable |
| Statewide NCLB Accountability Status |
| | READING | MATHEMATICS |
| Schools | Districts | Schools | Districts |
| N | % | N | % | N | % | N | % |
| Acceptable | 310 | 65.0 | 137 | 84.6 | 280 | 58.7 | 117 | 72.2 |
| SINI/DINI Year 1 | 67 | 14.0 | 10 | 6.2 | 103 | 21.6 | 29 | 17.9 |
| SINI/DINI Year 2 | 45 | 9.4 | 12 | 7.4 | 36 | 7.5 | 6 | 3.7 |
| Corrective Action/Level 3 | 28 | 5.9 | 3 | 1.9 | 32 | 6.7 | 10 | 6.2 |
| Restructure Planning/Level 4 | 19 | 4.0 | 0 | 0.0 | 20 | 4.2 | 0 | 0.0 |
| Restructuring/Level 5 | 8 | 1.7 | 0 | 0.0 | 6 | 1.3 | 0 | 0.0 |
| State Total | 477 | 100.0 | 162 | 100.0 | 477 | 100 | 162 | 100.0 |
|
|
Student Assessment
* indicates total number of test takers is 10 or less.
Blank indicates no science assessment test administered.
|
| NECAP Longitudinal Reports |
| 1) NECAP Teaching Year District Tested at Grade Comparison |
Reading and Math |
| 2) NECAP Teaching Year District "Cohort" History Comparison |
Reading and Math |
| 3) NECAP Teaching Year District vs. State by Tested at Grade |
Math |
Reading |
| |
| 4) NECAP Teaching Year District vs. State by "Cohort" History |
Math |
Reading |
| |
| 5) NECAP Teaching Year District GAP Analysis by Tested at Grade |
Math |
Reading |
| |
| 6) NECAP and NH ALPs Teaching Year Average Index Score and GAP analysis |
Math |
Reading |
Science |
Writing |
| 7) NECAP and NH ALPs Teaching Year Percent of students at each index level |
Math |
Reading |
Science |
Writing |
| 8) NECAP and NH ALPs Teaching Year Median Student Growth Percentile (SGP) and GAP analysis |
Math |
Reading |
| |
| 9) NECAP and NH ALPs Teaching Year Percent of students at each Student Growth Percentile (SGP) Grouping |
Math |
Reading |
| |
|
|
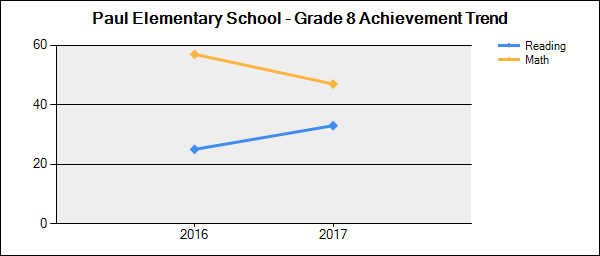
Student Achievement Trends
N is the number of students participating.
% is the percent of students scoring proficient or above.
Click on a grade to show the achievement trend for that grade. |
 |
| Grade | Content Area | 2009-2010 | 2010-2011 | 2011-2012 | 2012-2013 | 2013-2014 |
| N | % | N | % | N | % | N | % | N | % |
| 3 | Reading | 43 | 81 | 45 | 78 | 47 | 72 | 39 | 59 | 46 | 78 |
| Mathematics | 43 | 86 | 45 | 89 | 47 | 70 | 39 | 69 | 46 | 59 |
| 4 | Reading | 59 | 75 | 39 | 67 | 47 | 66 | 48 | 79 | 34 | 74 |
| Mathematics | 59 | 78 | 39 | 74 | 47 | 70 | 48 | 79 | 34 | 68 |
| 5 | Reading | 50 | 68 | 55 | 73 | 40 | 72 | 45 | 80 | 52 | 88 |
| Mathematics | 50 | 68 | 55 | 78 | 40 | 75 | 44 | 75 | 51 | 65 |
| Writing | 0 | | 55 | 58 | 40 | 57 | 45 | 67 | 51 | 78 |
| 6 | Reading | 61 | 64 | 49 | 71 | 57 | 75 | 40 | 78 | 43 | 88 |
| Mathematics | 61 | 69 | 49 | 63 | 57 | 68 | 40 | 75 | 43 | 65 |
| 7 | Reading | 63 | 75 | 55 | 75 | 48 | 75 | 56 | 75 | 41 | 83 |
| Mathematics | 63 | 65 | 55 | 76 | 48 | 65 | 56 | 68 | 41 | 68 |
| 8 | Reading | 46 | 48 | 62 | 90 | 53 | 72 | 48 | 79 | 57 | 81 |
| Mathematics | 46 | 57 | 62 | 68 | 53 | 68 | 48 | 60 | 56 | 57 |
| Writing | 0 | | 62 | 68 | 53 | 45 | 48 | 65 | 56 | 59 |
|
|
| National Assessment of Educational Progress (NAEP) Student Achievement Data-Percent of NH Students At or Above Each Achievement Level (Based on the Winter 2007 NAEP Assessment) |
| NAEP achievement levels are indicated as follows: B+ for Basic or above, P+ for Proficient or above, and A for Advanced |
| Reading |
| Grade | B+ | P+ | A |
| 4 | 76 | 41 | 11 |
| 8 | 82 | 37 | 3 |
| Math |
| Grade | B+ | P+ | A |
| 4 | 91 | 52 | 7 |
| 8 | 78 | 38 | 8 |
|
|
|
|
|

