View State Profile
Return to Hampstead District
Schools
Hampstead Central School
Hampstead Middle School
Hampstead Pre School
|
School:Hampstead Central School
|
View: State Profile
Home |
Compare |
Glossary
Select a School Year:
|
|
|
| General Information |
 |
School: Hampstead Central School (22755) |
NCES School ID: 00153 |
| District: Hampstead (223) |
NCES District ID: 3303480 |
| SAU: Hampstead SAU Office (55) |
School Web Site: hcs.hampsteadschools.net |
| Superintendent: Robert Thompson |
SAU Telephone: 603-329-6744 |
| Admin Principal: Terrilyn Cheney |
School Telephone: 603-329-6326 |
| Address: 21 Emerson Ave., Hampstead, NH 03841-2264 |
School Fax: 603-329-4323 |
| School Open Date:
| School Close Date:
|
| School Type: Public School |
Grades Offered: P K 1-4 |
| Federal Accountability Status Met:
Yes |
NH Accountability Status Met: N/A |
| School Report Card 2005-06 |
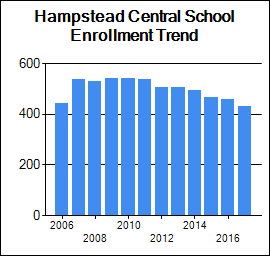
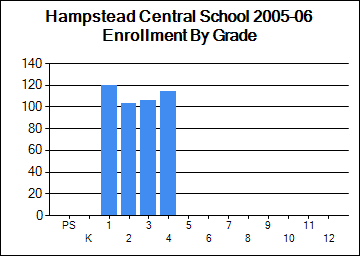
| Enrollment |
| | October 1 Enrollment | Average Class Size |
| Grade(s) | School | District | State | School | District | State |
| PreSchool | 0 | 62 | 2,525 | | | |
| Kindergarten | 0 | 0 | 10,360 | | | |
| Readiness | 0 | 0 | 210 | | | |
| Grade 1 | 120 | 120 | 14,733 | 22 | 22 | 17 |
| Grade 2 | 103 | 103 | 14,941 | 18 | 18 | 18 |
| Grade 3 | 106 | 106 | 14,985 | 18 | 18 | 19 |
| Grade 4 | 114 | 114 | 15,151 | 23 | 23 | 20 |
| Grade 5 | 0 | 128 | 15,646 | 0 | 21 | 21 |
| Grade 6 | 0 | 130 | 16,096 | 0 | 22 | 21 |
| Grade 7 | 0 | 143 | 16,358 | 0 | 24 | 21 |
| Grade 8 | 0 | 141 | 17,038 | 0 | 24 | 21 |
| Grade 9 | 0 | 0 | 18,269 | | | |
| Grade 10 | 0 | 0 | 17,478 | | | |
| Grade 11 | 0 | 0 | 16,364 | | | |
| Grade 12 | 0 | 0 | 15,001 | | | |
| Total Enrollment | 443 | 1,047 | 205,767 | | | |
|
|
| School Safety |
| | School | District | State |
| School Safety Incidences | 3 | 8 | 2,692 |
| Total Number of Incidents | 3 | 21 | 29,532 |
| No. of Incidents/1,000 students | 7 | 20 | 144 |
[View Safety Survey]
|
| Attendance/Four-Year Graduation Rate |
| | School | District | State |
| PreSchool Attendance Rate | | 98.6 | 91.2 |
| Elem/Middle Attendance Rate (Target: 90%) | 96.6 | 96.4 | 95.4 |
| High School Four-Year Graduation Rate (Target: 75%) | | | 87.8 |
[More Details]
|
|
| Teacher Quality |
| | School | District | State |
| N | % | N | % | N | % |
| Core Classes Taught by non-HQT | 0 | 0 | 14 | 7.7 | 743 | 2.1 |
| Core Classes Taught by non-HQT in High-Poverty Schools | | N/A | | N/A | | 0.3 |
| Core Classes Taught by non-HQT in Low-Poverty Schools | | N/A | | N/A | | 0.6 |
| Employed Under Emergency Credentials | N/A | N/A | N/A | N/A | 27 | 0.2 |
| Bachelor's Degree | | N/C | | 30.9 | | 51.9 |
| Master's Degree | | N/C | | 68 | | 46.7 |
| Degree beyond Master's Degree | | N/C | | 1 | | 1 |
[More Details]
|
|
| School Staff |
| | School | District | State |
| Teachers | 45 | 99 | 15,535 |
| Instructional Support | 28 | 53 | 6,712 |
| Librarians | 0 | 0 | 305 |
| Specialists | 1 | 6 | 2,451 |
| Admin Support | 4 | 10 | 1,252 |
| All Other Support | 10 | 20 | 3,837 |
[More Details]
|
|
| Improvement Status |
| Status for 2005-2006 School Year | Content Area | Met AYP Requirements | Status for 2006-2007 School Year |
| Acceptable | Reading | Yes | Acceptable |
| Acceptable | Math | Yes | Acceptable |
| Acceptable | Other | Yes | Acceptable |
|
|
Student Assessment
* indicates total number of test takers is 10 or less.
Blank indicates no science assessment test administered.
|
| NECAP Longitudinal Reports |
| 1) NECAP Teaching Year District Tested at Grade Comparison |
Reading and Math |
| 2) NECAP Teaching Year District "Cohort" History Comparison |
Reading and Math |
| 3) NECAP Teaching Year District vs. State by Tested at Grade |
Math |
Reading |
| |
| 4) NECAP Teaching Year District vs. State by "Cohort" History |
Math |
Reading |
| |
| 5) NECAP Teaching Year District GAP Analysis by Tested at Grade |
Math |
Reading |
| |
| 6) NECAP and NH ALPs Teaching Year Average Index Score and GAP analysis |
Math |
Reading |
Science |
Writing |
| 7) NECAP and NH ALPs Teaching Year Percent of students at each index level |
Math |
Reading |
Science |
Writing |
| 8) NECAP and NH ALPs Teaching Year Median Student Growth Percentile (SGP) and GAP analysis |
Math |
Reading |
| |
| 9) NECAP and NH ALPs Teaching Year Percent of students at each Student Growth Percentile (SGP) Grouping |
Math |
Reading |
| |
|
|
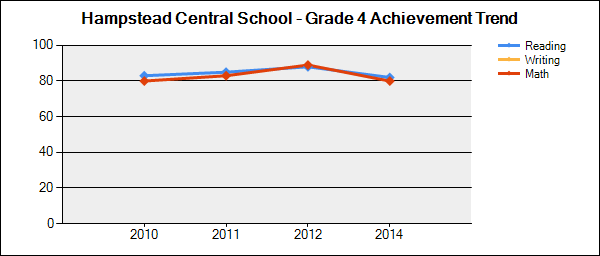
Student Achievement Trends
N is the number of students participating.
% is the percent of students scoring proficient or above.
Click on a grade to show the achievement trend for that grade. |
 |
| Grade | Content Area | 2009-2010 | 2010-2011 | 2011-2012 | 2012-2013 | 2013-2014 |
| N | % | N | % | N | % | N | % | N | % |
| 3 | Reading | 118 | 83 | 89 | 89 | 99 | 95 | 109 | 85 | 94 | 90 |
| Mathematics | 118 | 85 | 89 | 75 | 99 | 81 | 109 | 81 | 94 | 77 |
| 4 | Reading | 94 | 83 | 118 | 85 | 85 | 88 | 103 | 85 | 115 | 82 |
| Mathematics | 94 | 80 | 118 | 83 | 85 | 89 | 103 | 85 | 115 | 80 |
|
|
| National Assessment of Educational Progress (NAEP) Student Achievement Data-Percent of NH Students At or Above Each Achievement Level (Based on the Winter 2005 NAEP Assessment) |
| NAEP achievement levels are indicated as follows: B+ for Basic or above, P+ for Proficient or above, and A for Advanced |
| Reading |
| Grade | B+ | P+ | A |
| 4 | 74 | 39 | 9 |
| 8 | 80 | 38 | 4 |
| Math |
| Grade | B+ | P+ | A |
| 4 | 89 | 47 | 6 |
| 8 | 77 | 35 | 7 |
|
|
|
|
|

