View State Profile
Return to Fall Mountain Regional District
Schools
Acworth Elementary School
Alstead Primary School
Charlestown Middle School
Charlestown Primary School
Fall Mountain Regional -Pre School Program
Fall Mountain Regional High School
N. Charlestown Community School
North Walpole School
Sarah Porter School
Vilas Elementary School
Walpole Elementary School
Walpole Primary School
Career and Technical Education Centers
Fall Mountain Regional High School CTE
|
School:Charlestown Middle School
|
View: State Profile
Home |
Compare |
Glossary
Select a School Year:
|
|
|
| General Information |
 |
School: Charlestown Middle School (22975) |
NCES School ID: 00114 |
| District: Fall Mountain Regional (174) |
NCES District ID: 3302990 |
| SAU: Fall Mountain Regional SAU Office (60) |
School Web Site: sites.google.com/a/apps.sau60.org/cms |
| Superintendent: Christopher Spence |
SAU Telephone: 603-835-0006 |
| Admin Principal: Cory LeClair |
School Telephone: 603-826-7711 |
| Address: 307 Main St., Charlestown, NH 03603-0325 |
School Fax: 603-826-3102 |
| School Open Date:
| School Close Date:
|
| School Type: Public School |
Grades Offered: 5-8 |
| Federal Accountability Status:
None Assigned |
NH Adequacy Status Met: N/A |
| School Report Card 2014-15 |
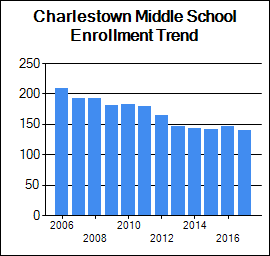
| Enrollment |
| | October 1 Enrollment | Average Class Size |
| Grade(s) | School | District | State | School | District | State |
| PreSchool | 0 | 73 | 3,557 | | | |
| Kindergarten | 0 | 103 | 11,570 | | | |
| Readiness | 0 | 0 | 55 | | | |
| Grade 1 | 0 | 118 | 13,157 | 0 | 16 | 17 |
| Grade 2 | 0 | 107 | 13,408 | 0 | 19 | 18 |
| Grade 3 | 0 | 114 | 13,553 | 0 | 17 | 19 |
| Grade 4 | 0 | 96 | 13,558 | 0 | 15 | 19 |
| Grade 5 | 0 | 103 | 13,978 | 0 | 21 | 20 |
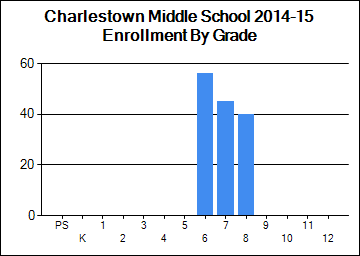
| Grade 6 | 56 | 114 | 13,960 | 19 | 16 | 21 |
| Grade 7 | 45 | 105 | 14,307 | 15 | 15 | 21 |
| Grade 8 | 40 | 106 | 14,343 | 13 | 15 | 22 |
| Grade 9 | 0 | 138 | 15,461 | | | |
| Grade 10 | 0 | 117 | 14,746 | | | |
| Grade 11 | 0 | 143 | 14,263 | | | |
| Grade 12 | 0 | 128 | 13,671 | | | |
| Total Enrollment | 141 | 1,565 | 183,604 | | | |
|
|
| School Safety |
| | School | District | State |
| School Safety Incidences | 0 | 3 | 1,000 |
| Total Number of Incidents | 10 | 64 | 6,560 |
| No. of Incidents/1,000 students | 71 | 41 | 36 |
[View Safety Survey]
|
| Attendance/Four-Year Graduation Rate |
| | School | District | State |
| PreSchool Attendance Rate | | 91.8 | 95.9 |
| Elem/Middle Attendance Rate (Target: 90%) | 94.8 | 95.2 | 95.2 |
| High School Four-Year Graduation Rate (Target: 90%) | | 93.6 | 88.1 |
[More Details]
|
|
| Teacher Quality |
| | School | District | State |
| N | % | N | % | N | % |
| Core Classes Taught by non-HQT | 6 | 10.2 | 12 | 3.2 | 3439 | 6.3 |
| Core Classes Taught by non-HQT in High-Poverty Schools | | 10.2 | | 1.6 | | 0.9 |
| Core Classes Taught by non-HQT in Low-Poverty Schools | | N/A | | N/A | | 2.1 |
| Employed Under Emergency Credentials | N/A | N/A | N/A | N/A | 2 | 0.02 |
| Bachelor's Degree | | N/C | | 62.6 | | 40.9 |
| Master's Degree | | N/C | | 37.4 | | 57.7 |
| Degree beyond Master's Degree | | N/C | | 0.0 | | 1.1 |
[More Details]
|
|
| School Staff |
| | School | District | State |
| Teachers | 15 | 136 | 14,726 |
| Instructional Support | 6 | 66 | 7,007 |
| Librarians | 0 | 2 | 318 |
| Specialists | 11 | 39 | 2,713 |
| Admin Support | 2 | 18 | 1,243 |
| All Other Support | 5 | 33 | 3,535 |
[More Details]
|
|
| State and Federal Accountability |
| New Hampshire School Adequacy Summary |
| Met Input-Based Accountability System (IBAS): |
N/A
|
| Met Performance-Based School Accountability System (PBAS): |
N/A
|
| Performance Score: |
N/A
|
| Provides Opportunity for an Adequate Education: |
N/A
|
|
|
N is the number of students participating.
% is the percent of students scoring proficient or above.
Click on a grade to show the achievement results for that grade. |
 |
| Grade | Content Area |
School |
State |
| N | % |
N | % |
| 6 | English Language Arts | 55 | 56 |
13,539 | 57 |
| Mathematics |
55 | 44 |
13,581 | 46 |
| 7 | English Language Arts | 42 | 48 |
13,656 | 62 |
| Mathematics |
43 | 44 |
13,672 | 50 |
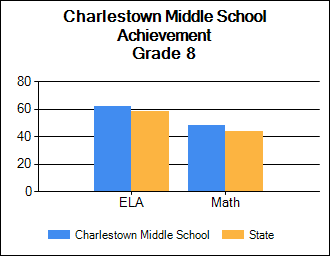
| 8 | English Language Arts | 40 | 62 |
13,487 | 58 |
| Mathematics |
40 | 48 |
13,509 | 44 |
|
|
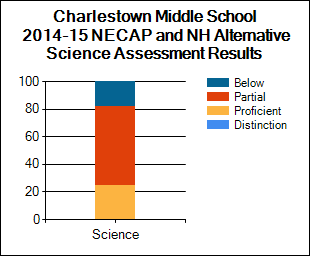
| NECAP and NH Alternative Assessment Science Results 2014-15 |
Student Assessment
* indicates total number of test takers is 10 or less.
Blank indicates no science assessment test administered.
|
| Achievement Level (%) | Science |
| School | District | State |
| Substantially Below Proficient (%) |
18
|
18
| 19 |
| Partially Proficient (%) |
58
|
47
| 46 |
| Proficient (%) |
25
|
34
| 34 |
| Proficient with Distinction (%) |
0
|
1
| 2 |
| Longitudinal Reports and Subgroup Reporting |
| Percent of students at each achievement level |
Math |
Reading |
Science |
|
|
|
|
| National Assessment of Educational Progress (NAEP) Student Achievement Data-Percent of NH Students At or Above Each Achievement Level (Based on the Winter 2013 NAEP Assessment) |
| NAEP achievement levels are indicated as follows: B+ for Basic or above, P+ for Proficient or above, and A for Advanced |
| Reading |
| Grade | B+ | P+ | A |
| 4 | 80 | 45 | 11 |
| 8 | 84 | 44 | 6 |
| Math |
| Grade | B+ | P+ | A |
| 4 | 93 | 59 | 12 |
| 8 | 84 | 47 | 13 |
|
|
|
|
|

