View State Profile
Return to Hampton District
Schools
Adeline C. Marston School
Hampton Academy
Hampton Centre School
|
School:Hampton Centre School
|
View: State Profile
Home |
Compare |
Glossary
Select a School Year:
|
|
|
| General Information |
 |
School: Hampton Centre School (20770) |
NCES School ID: 00469 |
| District: Hampton (225) |
NCES District ID: 3303510 |
| SAU: Hampton SAU Office (90) |
School Web Site: https://centre-school.sau90.org/ |
| Superintendent: Lois Costa |
SAU Telephone: 603-926-4560 |
| Admin Principal: Timothy Lannan |
School Telephone: 603-926-8706 |
| Address: 53 Winnacunnet Rd., Hampton, NH 03842-2110 |
School Fax: 603-926-1177 |
| School Open Date:
| School Close Date:
|
| School Type: Public School |
Grades Offered: P K 1-2 |
| Federal Accountability Status:
None Assigned |
NH Adequacy Status Met: N/A |
| School Report Card 2015-16 |
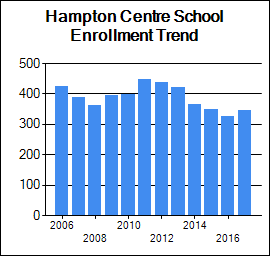
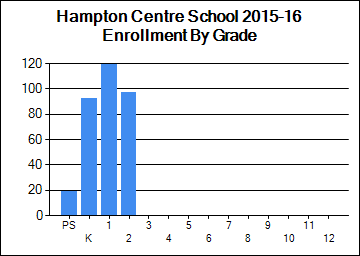
| Enrollment |
| | October 1 Enrollment | Average Class Size |
| Grade(s) | School | District | State | School | District | State |
| PreSchool | 19 | 19 | 3,670 | | | |
| Kindergarten | 92 | 92 | 11,187 | | | |
| Readiness | 0 | 0 | 45 | | | |
| Grade 1 | 119 | 119 | 12,898 | 17 | 17 | 17 |
| Grade 2 | 97 | 97 | 13,186 | 16 | 16 | 18 |
| Grade 3 | 0 | 128 | 13,450 | 0 | 18 | 19 |
| Grade 4 | 0 | 132 | 13,613 | 0 | 19 | 19 |
| Grade 5 | 0 | 143 | 13,594 | 0 | 20 | 20 |
| Grade 6 | 0 | 131 | 14,015 | 0 | 16 | 20 |
| Grade 7 | 0 | 135 | 14,030 | 0 | 22 | 21 |
| Grade 8 | 0 | 115 | 14,216 | 0 | 19 | 21 |
| Grade 9 | 0 | 0 | 15,169 | | | |
| Grade 10 | 0 | 0 | 14,578 | | | |
| Grade 11 | 0 | 0 | 13,923 | | | |
| Grade 12 | 0 | 0 | 13,752 | | | |
| Total Enrollment | 327 | 1,111 | 181,339 | | | |
|
|
| School Safety |
| | School | District | State |
| School Safety Incidences | 0 | 0 | 928 |
| Total Number of Incidents | 0 | 0 | 5,885 |
| No. of Incidents/1,000 students | 0 | 0 | 32 |
[View Safety Survey]
|
| Attendance/Four-Year Graduation Rate |
| | School | District | State |
| PreSchool Attendance Rate | | | 94.8 |
| Elem/Middle Attendance Rate (Target: 90%) | 95.9 | 96.2 | 95.4 |
| High School Four-Year Graduation Rate (Target: 90%) | | | 88.2 |
[More Details]
|
|
|
|
| School Staff |
| | School | District | State |
| Teachers | 29 | 98 | 14,770 |
| Instructional Support | 16 | 37 | 7,044 |
| Librarians | 1 | 3 | 321 |
| Specialists | 6 | 17 | 2,743 |
| Admin Support | 2 | 6 | 1,237 |
| All Other Support | 5 | 17 | 3,612 |
[More Details]
|
|
| State and Federal Accountability |
| New Hampshire School Adequacy Summary |
| Met Input-Based Accountability System (IBAS): |
N/A
|
| Met Performance-Based School Accountability System (PBAS): |
N/A
|
| Performance Score: |
N/A
|
| Provides Opportunity for an Adequate Education: |
N/A
|
|
|
|
|
| NECAP and NH Alternative Assessment Science Results 2015-16 |
Student Assessment
* indicates total number of test takers is 10 or less.
Blank indicates no science assessment test administered.
|
|
|
|
|
| National Assessment of Educational Progress (NAEP) Student Achievement Data-Percent of NH Students At or Above Each Achievement Level (Based on the Winter 2015 NAEP Assessment) |
| NAEP achievement levels are indicated as follows: B+ for Basic or above, P+ for Proficient or above, and A for Advanced |
| Reading |
| Grade | B+ | P+ | A |
| 4 | 79 | 46 | 12 |
| 8 | 85 | 45 | 5 |
| Math |
| Grade | B+ | P+ | A |
| 4 | 91 | 51 | 10 |
| 8 | 84 | 46 | 12 |
|
|
|
|
|

