View State Profile
Return to Lebanon District
Schools
Hanover Street School
Lebanon High School
Lebanon Middle School
Mt. Lebanon School
Seminary Hill School
|
School:Seminary Hill School
|
View: State Profile
Home |
Compare |
Glossary
Select a School Year:
|
|
|
| General Information |
 |
School: Seminary Hill School (21365) |
NCES School ID: 00223 |
| District: Lebanon (295) |
NCES District ID: 3304230 |
| SAU: Lebanon SAU Office (88) |
School Web Site: |
| Superintendent: Amy Allen |
SAU Telephone: 603-448-1634 |
| Principal: Not Listed |
School Telephone: 603-298-8500 |
| Address: 20 Seminary Hill, W. Lebanon, NH 03784-1799 |
School Fax: 603-298-6430 |
| School Open Date:
| School Close Date:
6/30/2012 |
| School Type: Public School |
Grades Offered: 5-6 |
| Federal Accountability Status Met:
NO |
NH Accountability Status Met: N/A |
| School Report Card 2009-10 |
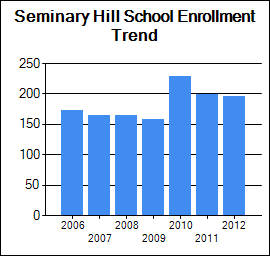
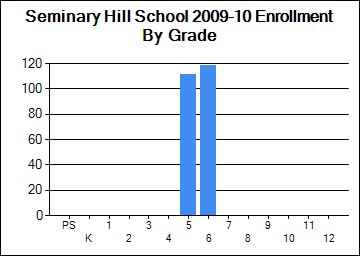
| Enrollment |
| | October 1 Enrollment | Average Class Size |
| Grade(s) | School | District | State | School | District | State |
| PreSchool | 0 | 27 | 2,987 | | | |
| Kindergarten | 0 | 117 | 11,969 | | | |
| Readiness | 0 | 0 | 194 | | | |
| Grade 1 | 0 | 105 | 13,971 | 0 | 18 | 17 |
| Grade 2 | 0 | 107 | 14,215 | 0 | 18 | 18 |
| Grade 3 | 0 | 105 | 14,246 | 0 | 18 | 19 |
| Grade 4 | 0 | 93 | 14,560 | 0 | 16 | 20 |
| Grade 5 | 111 | 111 | 14,682 | 18 | 18 | 20 |
| Grade 6 | 118 | 118 | 15,082 | 20 | 20 | 20 |
| Grade 7 | 0 | 148 | 15,345 | 0 | 0 | 20 |
| Grade 8 | 0 | 170 | 15,517 | 0 | 0 | 21 |
| Grade 9 | 0 | 170 | 17,108 | | | |
| Grade 10 | 0 | 170 | 16,277 | | | |
| Grade 11 | 0 | 168 | 15,399 | | | |
| Grade 12 | 0 | 174 | 15,588 | | | |
| Total Enrollment | 229 | 1,783 | 197,160 | | | |
|
|
| School Safety |
| | School | District | State |
| School Safety Incidences | 3 | 11 | 1,591 |
| Total Number of Incidents | 22 | 80 | 28,308 |
| No. of Incidents/1,000 students | 96 | 45 | 144 |
[View Safety Survey]
|
| Attendance/Four-Year Graduation Rate |
| | School | District | State |
| PreSchool Attendance Rate | | | 93.2 |
| Elem/Middle Attendance Rate (Target: 90%) | 94.5 | 95.1 | 95 |
| High School Four-Year Graduation Rate (Target: 80%) | | 94.5 | 85.9 |
[More Details]
|
|
| Teacher Quality |
| | School | District | State |
| N | % | N | % | N | % |
| Core Classes Taught by non-HQT | N/R | N/R | N/R | | 148 | 0.8 |
| Core Classes Taught by non-HQT in High-Poverty Schools | | N/A | | N/A | | 0.4 |
| Core Classes Taught by non-HQT in Low-Poverty Schools | | N/A | | N/A | | 0.1 |
| Employed Under Emergency Credentials | N/A | N/A | N/A | N/A | 15 | 0.2 |
| Bachelor's Degree | | N/C | | 43.2 | | 47.8 |
| Master's Degree | | N/C | | 56.8 | | 51.2 |
| Degree beyond Master's Degree | | N/C | | 0 | | 0.7 |
[More Details]
|
|
| School Staff |
| | School | District | State |
| Teachers | 24 | 172 | 15,491 |
| Instructional Support | 11 | 78 | 7,219 |
| Librarians | 1 | 5 | 325 |
| Specialists | 3 | 15 | 2,577 |
| Admin Support | 1 | 13 | 1,287 |
| All Other Support | 3 | 21 | 3,761 |
[More Details]
|
|
| Improvement Status |
| Status for 2009-2010 School Year | Content Area | Met AYP Requirements | Status for 2010-2011 School Year |
| Acceptable | Reading | No | Acceptable |
| SINI Year 1 | Math | No | SINI Year 2 |
| Acceptable | Other | Yes | Acceptable |
| Statewide NCLB Accountability Status |
| | READING | MATHEMATICS |
| Schools | Districts | Schools | Districts |
| N | % | N | % | N | % | N | % |
| Acceptable | 289 | 61.1 | 131 | 80.4 | 249 | 52.6 | 103 | 63.2 |
| SINI/DINI Year 1 | 41 | 8.7 | 11 | 6.7 | 67 | 14.2 | 30 | 18.4 |
| SINI/DINI Year2 | 57 | 12.1 | 13 | 8.0 | 73 | 15.4 | 14 | 8.6 |
| Corrective Action/Level 3 | 37 | 7.8 | 8 | 4.9 | 35 | 7.4 | 16 | 9.9 |
| Restructure Planning/Level 4 | 24 | 5.1 | 0 | 0.0 | 28 | 5.9 | 0 | 0.0 |
| Restructuring/Level 5&6 | 25 | 5.3 | 0 | 0.0 | 21 | 41.4 | 0 | 0.0 |
| State Total | 473 | 100.0 | 163 | 100.0 | 473 | 100 | 163 | 100.0 |
|
|
Student Assessment
* indicates total number of test takers is 10 or less.
Blank indicates no science assessment test administered.
|
| Achievement Level (%) | Reading | Mathematics | Writing | Science |
| School | District | State | School | District | State | School | District | State | School | District | State |
| Substantially Below Proficient (%) | 7 | 6 | 7 | 15 | 17 | 16 | | 2 | 8 | | 15 | 19 |
| Partially Proficient (%) | 21 | 17 | 16 | 21 | 19 | 18 | | 29 | 41 | | 38 | 45 |
| Proficient (%) | 56 | 55 | 56 | 45 | 43 | 45 | | 57 | 42 | | 46 | 34 |
| Proficient with Distinction (%) | 17 | 21 | 20 | 20 | 20 | 21 | | 11 | 7 | | 1 | 1 |
| Testing Participation (%) | 100 | 100 | 99 | 100 | 100 | 99 | | 100 | 98 | | 100 | 99 |
| For assessment rankings click on this link: | [Ranking Reports] |
| NECAP Longitudinal Reports |
| 1) NECAP Teaching Year District Tested at Grade Comparison |
Reading and Math |
| 2) NECAP Teaching Year District "Cohort" History Comparison |
Reading and Math |
| 3) NECAP Teaching Year District vs. State by Tested at Grade |
Math |
Reading |
| |
| 4) NECAP Teaching Year District vs. State by "Cohort" History |
Math |
Reading |
| |
| 5) NECAP Teaching Year District GAP Analysis by Tested at Grade |
Math |
Reading |
| |
| 6) NECAP and NH ALPs Teaching Year Average Index Score and GAP analysis |
Math |
Reading |
Science |
Writing |
| 7) NECAP and NH ALPs Teaching Year Percent of students at each index level |
Math |
Reading |
Science |
Writing |
| 8) NECAP and NH ALPs Teaching Year Median Student Growth Percentile (SGP) and GAP analysis |
Math |
Reading |
| |
| 9) NECAP and NH ALPs Teaching Year Percent of students at each Student Growth Percentile (SGP) Grouping |
Math |
Reading |
| |
|
|
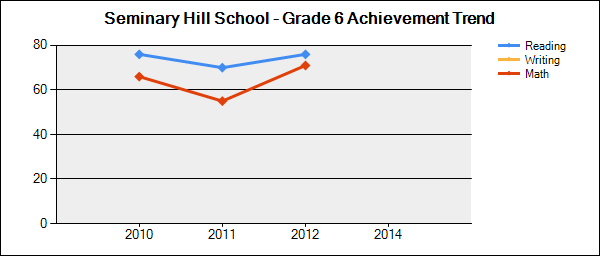
Student Achievement Trends
N is the number of students participating.
% is the percent of students scoring proficient or above.
Click on a grade to show the achievement trend for that grade. |
 |
| Grade | Content Area | 2009-2010 | 2010-2011 | 2011-2012 | 2012-2013 | 2013-2014 |
| N | % | N | % | N | % | N | % | N | % |
| 5 | Reading | 110 | 68 | 93 | 75 | 104 | 70 | | | | |
| Mathematics | 111 | 62 | 94 | 61 | 104 | 69 | | | | |
| Writing | 0 | | 93 | 37 | 104 | 34 | | | | |
| 6 | Reading | 117 | 76 | 105 | 70 | 92 | 76 | | | | |
| Mathematics | 118 | 66 | 105 | 55 | 92 | 71 | | | | |
|
|
| National Assessment of Educational Progress (NAEP) Student Achievement Data-Percent of NH Students At or Above Each Achievement Level (Based on the Winter 2009 NAEP Assessment) |
| NAEP achievement levels are indicated as follows: B+ for Basic or above, P+ for Proficient or above, and A for Advanced |
| Reading |
| Grade | B+ | P+ | A |
| 4 | 77 | 41 | 9 |
| 8 | 81 | 39 | 4 |
| Math |
| Grade | B+ | P+ | A |
| 4 | 92 | 56 | 10 |
| 8 | 82 | 43 | 11 |
|
|
|
|
|

