View State Profile
Change District:
Schools
Waterville Valley Elementary School
|
District:Waterville Valley
|
View: State Profile
Home |
Compare |
Glossary
Select a School Year:
|
|
|
| General Information |
 |
District: Waterville Valley
(553)
|
SAU: Plymouth SAU Office (48) |
| Address: 47 Old Ward Bridge Rd., Plymouth, NH 03264-1296 |
Telephone: 603-536-1254 |
| NCES District ID: 3306910 |
Fax: 603-536-3545 |
| Superintendent: Kyla A Welch |
Web Site: |
| |
| District Report Card 2012-13 |
| Enrollment |
| | October 1 Enrollment | Average Class Size |
| Grade(s) | District | State | District | State |
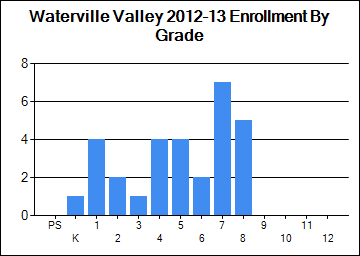
| PreSchool | 0 | 3,200 | | |
| Kindergarten | 1 | 11,888 | | |
| Readiness | 0 | 75 | | |
| Grade 1 | 4 | 13,609 | 0 | 18 |
| Grade 2 | 2 | 13,518 | 0 | 18 |
| Grade 3 | 1 | 13,841 | 0 | 19 |
| Grade 4 | 4 | 13,880 | 0 | 19 |
| Grade 5 | 4 | 14,225 | 0 | 21 |
| Grade 6 | 2 | 14,242 | 0 | 21 |
| Grade 7 | 7 | 14,645 | 0 | 22 |
| Grade 8 | 5 | 14,726 | 0 | 22 |
| Grade 9 | 0 | 16,148 | | |
| Grade 10 | 0 | 15,079 | | |
| Grade 11 | 0 | 14,475 | | |
| Grade 12 | 0 | 14,404 | | |
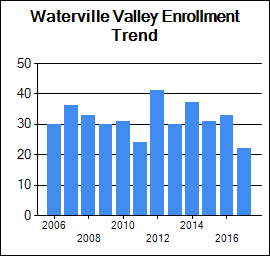
| Total Enrollment | 30 | 187,962 | | |
|
|
| School Safety |
| | District | State |
| School Safety Incidences | 0 | 943 |
| Total Number of Incidents | 2 | 22,899 |
| No. of Incidents/1,000 students | 67 | 122 |
|
| Attendance/Four-Year Graduation Rate |
| | District | State |
| PreSchool Attendance Rate | | 92.1 |
| Elem/Middle Attendance Rate (Target: 90%) | 95.3 | 95.4 |
| High School Four-Year Graduation Rate (Target: 90%) | | 87.8 |
[More Details]
|
|
| Teacher Quality |
| | District | State |
| N | % | N | % |
| Core Classes Taught by non-HQT | 0 | 0.0 | 1157 | 2.1 |
| Core Classes Taught by non-HQT in High-Poverty Schools | | N/A | | 0.3 |
| Core Classes Taught by non-HQT in Low-Poverty Schools | | 0.0 | | 0.5 |
| Employed Under Emergency Credentials | N/A | N/A | 13 | 0.11 |
| Bachelor's Degree | | 34.1 | | 21.0 |
| Master's Degree | | 65.9 | | 26.9 |
| Degree beyond Master's Degree | | 0.0 | | 0.5 |
[More Details]
|
|
| School Staff |
| | District | State |
| Teachers | 4 | 14,921 |
| Instructional Support | 1 | 6,853 |
| Librarians | 0 | 312 |
| Specialists | 0 | 2,572 |
| Admin Support | 1 | 1,244 |
| All Other Support | 0 | 3,604 |
[More Details]
|
|
| State and Federal Accountability |
| AYP Status for 2012-2013 School Year | Content Area | On June 26, 2013 New Hampshire's waiver request for flexibility from certain requirements of the Elementary and Secondary Education Act (ESEA) was approved for two years by the U.S. Department of Education. As a result, the Adequate Yearly Progress (AYP) federal accountability system and related school or district or "in need of improvement" designations were suspended in favor of a differentiated accountability system; thus, the 2012-13 report card reflects the transition. The new system sets individual performance targets (referred to as Annual Measurable Objectives) for each school and each student subgroup of 11 or more students over a six year time span, with the goal of reducing any achievement gaps by half. The waiver also focuses support on Title I schools in the greatest need of assistance, beginning in the 2013-14 school year. Click the link below for a list of designated schools:
Priority / Focus / Reward Schools |
| Acceptable | Reading |
| Acceptable | Math |
| Acceptable | Other |
| Annual Measurable Objectives (AMOs) |
| Subject | Student Group | Target | Actual | Met |
| Reading | Whole School |
100.0 | 100.0 | Y | | Reading | White |
100.0 | 100.0 | Y | | Math | Whole School |
100.0 | 100.0 | Y | | Math | White |
100.0 | 100.0 | Y | | Y=Yes - Y(RC)=Yes(Risk Corridor) - N=No |
|
|
| Assessment Rankings |
| Ranking School Type | Subject | Nbr. of Students | Index Score and Std Error | Index Score Ranking | No. of Students Prior Year | Prior Year Index Score and Std Error | Index Score Improvement | Index Score Improvement Ranking |
|
Elem/Middle | Math | 20 | 100 | 1 of 156 | 20 | 100 | 0 | 68 of 156 | |
Elem/Middle | Read | 20 | 100 | 1 of 156 | 20 | 100 | 0 | 88 of 156 |
|
|
Student Assessment
* indicates total number of test takers is 10 or less.
Blank indicates no science assessment test administered.
|
| Achievement Level (%) | Reading | Mathematics | Writing | Science |
| District | State | District | State | District | State | District | State |
| Substantially Below Proficient (%) | 0 | 6 | 0 | 15 | | 9 | | 17 |
| Partially Proficient (%) | 0 | 15 | 4 | 17 | | 35 | | 45 |
| Proficient (%) | 43 | 56 | 39 | 44 | | 44 | | 36 |
| Proficient with Distinction (%) | 57 | 21 | 57 | 22 | | 11 | | 1 |
| Testing Participation (%) | 100 | 99 | 100 | 99 | | 98 | | 99 |
| NECAP Longitudinal Reports |
| 1) NECAP Teaching Year District Tested at Grade Comparison |
Reading and Math |
| 2) NECAP Teaching Year District "Cohort" History Comparison |
Reading and Math |
| 3) NECAP Teaching Year District vs. State by Tested at Grade |
Math |
Reading |
| |
| 4) NECAP Teaching Year District vs. State by "Cohort" History |
Math |
Reading |
| |
| 5) NECAP Teaching Year District GAP Analysis by Tested at Grade |
Math |
Reading |
| |
| 6) NECAP and NH ALPs Teaching Year Average Index Score and GAP analysis |
Math |
Reading |
Science |
Writing |
| 7) NECAP and NH ALPs Teaching Year Percent of students at each index level |
Math |
Reading |
Science |
Writing |
| 8) NECAP and NH ALPs Teaching Year Median Student Growth Percentile (SGP) and GAP analysis |
Math |
Reading |
| |
| 9) NECAP and NH ALPs Teaching Year Percent of students at each Student Growth Percentile (SGP) Grouping |
Math |
Reading |
| |
|
|
Student Achievement Trends
N is the number of students participating.
% is the percent of students scoring proficient or above.
Click on a grade to show the achievement trend for that grade. |
 |
| Grade | Content Area | 2009-2010 | 2010-2011 | 2011-2012 | 2012-2013 | 2013-2014 |
| N | % | N | % | N | % | N | % | N | % |
| 3 | Reading | 3 | 0 | 2 | 0 | 4 | 0 | 1 | 0 | 4 | 0 |
| Mathematics | 3 | | 2 | | 4 | | 1 | | 4 | |
| 4 | Reading | 6 | 0 | 3 | 0 | 2 | 0 | 3 | 0 | 1 | 0 |
| Mathematics | 6 | | 3 | | 2 | | 4 | | 1 | |
| 5 | Reading | 1 | 0 | 5 | 0 | 3 | 0 | 4 | 0 | 5 | 0 |
| Mathematics | 1 | | 5 | | 3 | | 4 | | 5 | |
| Writing | 0 | | 5 | | 3 | | 4 | | 5 | |
| 6 | Reading | 7 | 0 | 1 | 0 | 7 | 0 | 1 | 0 | 6 | 0 |
| Mathematics | 7 | | 1 | | 7 | | 2 | | 6 | |
| 7 | Reading | 2 | 0 | 7 | 0 | 5 | 0 | 7 | 0 | 5 | 0 |
| Mathematics | 2 | | 7 | | 5 | | 7 | | 5 | |
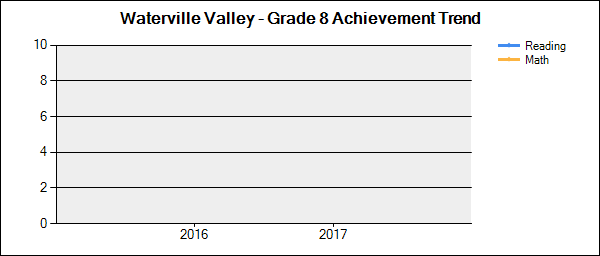
| 8 | Reading | 7 | 0 | 2 | 0 | 9 | 0 | 5 | 0 | 9 | 0 |
| Mathematics | 7 | | 2 | | 9 | | 5 | | 9 | |
| Writing | 0 | | 2 | | 9 | | 5 | | 9 | |
|
|
| National Assessment of Educational Progress (NAEP) Student Achievement Data-Percent of NH Students At or Above Each Achievement Level (Based on the Winter 2011 NAEP Assessment) |
| NAEP achievement levels are indicated as follows: B+ for Basic or above, P+ for Proficient or above, and A for Advanced |
| Reading |
| Grade | B+ | P+ | A |
| 4 | 78 | 43 | 10 |
| 8 | 84 | 40 | 4 |
| Math |
| Grade | B+ | P+ | A |
| 4 | 92 | 57 | 11 |
| 8 | 82 | 44 | 11 |
|
|
|
|
|

