View State Profile
Return to Merrimack District
Schools
James Mastricola Elementary School
James Mastricola Upper Elementary School
Merrimack High School
Merrimack Middle School
Reeds Ferry School
Thorntons Ferry School
|
School:James Mastricola Elementary School
|
View: State Profile
Home |
Compare |
Glossary
Select a School Year:
|
|
|
| General Information |
 |
School: James Mastricola Elementary School (21020) |
NCES School ID: 00276 |
| District: Merrimack (351) |
NCES District ID: 3304740 |
| SAU: Merrimack SAU Office (26) |
School Web Site: https://www.sau26.org/Domain/417 |
| Superintendent: Everett Olsen |
SAU Telephone: 603-424-6200 |
| Admin Principal: Michelle Romein |
School Telephone: 603-424-6218 |
| Address: 7 School St., Merrimack, NH 03054-3685 |
School Fax: 603-424-6239 |
| School Open Date:
| School Close Date:
|
| School Type: Public School |
Grades Offered: P K 1-4 |
| Federal Accountability Status:
None Assigned |
NH Adequacy Status Met: N/A |
| School Report Card 2015-16 |
| Enrollment |
| | October 1 Enrollment | Average Class Size |
| Grade(s) | School | District | State | School | District | State |
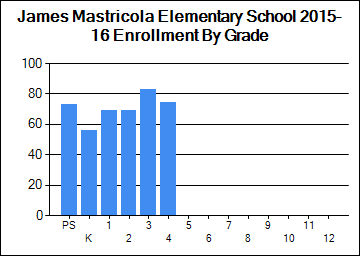
| PreSchool | 73 | 104 | 3,670 | | | |
| Kindergarten | 56 | 208 | 11,187 | | | |
| Readiness | 0 | 0 | 45 | | | |
| Grade 1 | 69 | 257 | 12,898 | 17 | 17 | 17 |
| Grade 2 | 69 | 278 | 13,186 | 23 | 21 | 18 |
| Grade 3 | 83 | 249 | 13,450 | 21 | 21 | 19 |
| Grade 4 | 74 | 284 | 13,613 | 25 | 22 | 19 |
| Grade 5 | 0 | 272 | 13,594 | 0 | 25 | 20 |
| Grade 6 | 0 | 306 | 14,015 | 0 | 24 | 20 |
| Grade 7 | 0 | 278 | 14,030 | 0 | 23 | 21 |
| Grade 8 | 0 | 300 | 14,216 | 0 | 19 | 21 |
| Grade 9 | 0 | 273 | 15,169 | | | |
| Grade 10 | 0 | 330 | 14,578 | | | |
| Grade 11 | 0 | 278 | 13,923 | | | |
| Grade 12 | 0 | 329 | 13,752 | | | |
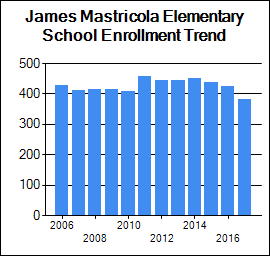
| Total Enrollment | 424 | 3,746 | 181,339 | | | |
|
|
| School Safety |
| | School | District | State |
| School Safety Incidences | 0 | 52 | 928 |
| Total Number of Incidents | 17 | 170 | 5,885 |
| No. of Incidents/1,000 students | 40 | 45 | 32 |
[View Safety Survey]
|
| Attendance/Four-Year Graduation Rate |
| | School | District | State |
| PreSchool Attendance Rate | | | 94.8 |
| Elem/Middle Attendance Rate (Target: 90%) | 96.3 | 96 | 95.4 |
| High School Four-Year Graduation Rate (Target: 90%) | | 88 | 88.2 |
[More Details]
|
|
|
|
| School Staff |
| | School | District | State |
| Teachers | 31 | 296 | 14,770 |
| Instructional Support | 28 | 191 | 7,044 |
| Librarians | 1 | 6 | 321 |
| Specialists | 4 | 42 | 2,743 |
| Admin Support | 3 | 25 | 1,237 |
| All Other Support | 13 | 104 | 3,612 |
[More Details]
|
|
| State and Federal Accountability |
| New Hampshire School Adequacy Summary |
| Met Input-Based Accountability System (IBAS): |
N/A
|
| Met Performance-Based School Accountability System (PBAS): |
N/A
|
| Performance Score: |
N/A
|
| Provides Opportunity for an Adequate Education: |
N/A
|
|
|
Student Achievement Trends
N is the number of students participating.
% is the percent of students scoring proficient or above.
Click on a grade to show the achievement trend for that grade.
Note: Grade 11 results are from the new SAT assessment tests and not comparable to 2014-2015 |
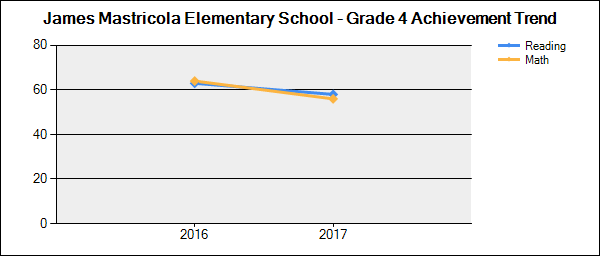 |
| Grade | Content Area | 2014-2015 | 2015-2016 |
| N | % | N | % |
| 3 | Reading |
71 | 56 | 80 | 62 | | Mathematics |
71 | 58 | 80 | 59 | | 4 | Reading |
94 | 51 | 71 | 63 | | Mathematics |
94 | 61 | 72 | 64 |
|
|
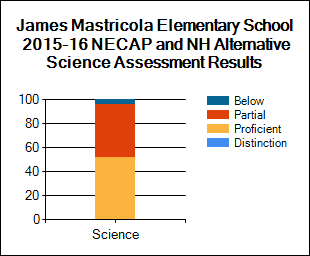
| NECAP and NH Alternative Assessment Science Results 2015-16 |
Student Assessment
* indicates total number of test takers is 10 or less.
Blank indicates no science assessment test administered.
|
| Achievement Level (%) | Science |
| School | District | State |
| Substantially Below Proficient (%) |
4
|
18
| 19 |
| Partially Proficient (%) |
44
|
47
| 45 |
| Proficient (%) |
52
|
35
| 34 |
| Proficient with Distinction (%) |
0
|
0
| 2 |
| Longitudinal Reports and Subgroup Reporting |
| Percent of students at each achievement level |
Math |
Reading |
Science |
|
|
|
| National Assessment of Educational Progress (NAEP) Student Achievement Data-Percent of NH Students At or Above Each Achievement Level (Based on the Winter 2015 NAEP Assessment) |
| NAEP achievement levels are indicated as follows: B+ for Basic or above, P+ for Proficient or above, and A for Advanced |
| Reading |
| Grade | B+ | P+ | A |
| 4 | 79 | 46 | 12 |
| 8 | 85 | 45 | 5 |
| Math |
| Grade | B+ | P+ | A |
| 4 | 91 | 51 | 10 |
| 8 | 84 | 46 | 12 |
|
|
|
|
|
New Hampshire Department of Education
101 Pleasant Street | Concord, NH | 03301-3494
Telephone: (603) 271-3494 | TDD Access: Relay NH 711
|
