View State Profile
Return to Nashua District
Schools
Academy of Learning And Technology
Academy of Learning and Technology (High)
Amherst Street School
Bicentennial Elementary School
Birch Hill Elementary School
Broad Street Elementary School
Charlotte Ave Elementary School
Dr. Norman W. Crisp School
Elm Street Middle School
Fairgrounds Elementary School
Fairgrounds Middle School
Ledge Street School
Main Dunstable School
Mt. Pleasant School
Nashua High School North
Nashua High School South
New Searles School
Pennichuck Middle School
Purple Panthers Preschool
Sunset Heights School
|
School:Pennichuck Middle School
|
View: State Profile
Home |
Compare |
Glossary
Select a School Year:
|
|
|
| General Information |
 |
School: Pennichuck Middle School (21825) |
NCES School ID: 00325 |
| District: Nashua (371) |
NCES District ID: 3304980 |
| SAU: Nashua SAU Office (42) |
School Web Site: schools.nashua.edu/middle/pennichuck |
| Superintendent: Mario Andrade |
SAU Telephone: 603-966-1000 |
| Admin Principal: Gabriel Falzarano |
School Telephone: 603-966-4140 |
| Address: 207 Manchester St., Nashua, NH 03060-8112 |
School Fax: 603-594-4413 |
| School Open Date:
| School Close Date:
|
| School Type: Public School |
Grades Offered: 6-8 |
| Federal Accountability Status Met:
No |
NH Accountability Status Met: N/A |
| School Report Card 2007-08 |
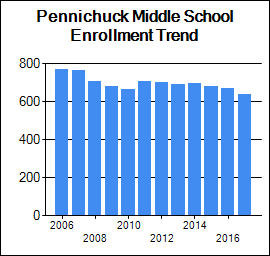
| Enrollment |
| | October 1 Enrollment | Average Class Size |
| Grade(s) | School | District | State | School | District | State |
| PreSchool | 0 | 150 | 2,614 | | | |
| Kindergarten | 0 | 796 | 10,489 | | | |
| Readiness | 0 | 0 | 261 | | | |
| Grade 1 | 0 | 886 | 14,364 | 0 | 20 | 17 |
| Grade 2 | 0 | 892 | 14,436 | 0 | 20 | 18 |
| Grade 3 | 0 | 948 | 14,624 | 0 | 22 | 18 |
| Grade 4 | 0 | 920 | 15,026 | 0 | 23 | 20 |
| Grade 5 | 0 | 894 | 15,203 | 0 | 22 | 21 |
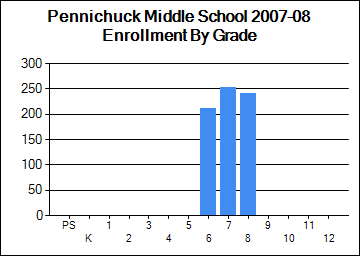
| Grade 6 | 211 | 803 | 15,318 | 0 | 0 | 20 |
| Grade 7 | 252 | 942 | 15,806 | 0 | 0 | 20 |
| Grade 8 | 241 | 1,023 | 16,218 | 0 | 0 | 21 |
| Grade 9 | 0 | 1,094 | 17,532 | | | |
| Grade 10 | 0 | 1,105 | 16,922 | | | |
| Grade 11 | 0 | 1,003 | 16,000 | | | |
| Grade 12 | 0 | 1,059 | 15,918 | | | |
| Total Enrollment | 704 | 12,515 | 200,772 | | | |
|
|
| School Safety |
| | School | District | State |
| School Safety Incidences | 0 | 39 | 2,512 |
| Total Number of Incidents | 415 | 2,780 | 31,578 |
| No. of Incidents/1,000 students | 589 | 222 | 157 |
[View Safety Survey]
|
| Attendance/Four-Year Graduation Rate |
| | School | District | State |
| PreSchool Attendance Rate | | 95.6 | 89.9 |
| Elem/Middle Attendance Rate (Target: 90%) | 94.3 | 94.9 | 95.3 |
| High School Four-Year Graduation Rate (Target: 75%) | | 91.2 | 87.9 |
[More Details]
|
|
| Teacher Quality |
| | School | District | State |
| N | % | N | % | N | % |
| Core Classes Taught by non-HQT | 6 | 4 | 66 | 4.3 | 323 | 0.9 |
| Core Classes Taught by non-HQT in High-Poverty Schools | | N/A | | N/A | | 0.2 |
| Core Classes Taught by non-HQT in Low-Poverty Schools | | N/A | | N/A | | 0.2 |
| Employed Under Emergency Credentials | N/A | N/A | 5 | 5 | 28 | 0.2 |
| Bachelor's Degree | | N/C | | 46.2 | | 50.5 |
| Master's Degree | | N/C | | 52.6 | | 48.3 |
| Degree beyond Master's Degree | | N/C | | 0.7 | | 0.9 |
[More Details]
|
|
| School Staff |
| | School | District | State |
| Teachers | 57 | 839 | 15,484 |
| Instructional Support | 26 | 355 | 6,877 |
| Librarians | 1 | 19 | 323 |
| Specialists | 5 | 89 | 2,644 |
| Admin Support | 4 | 70 | 1,296 |
| All Other Support | 17 | 301 | 3,789 |
[More Details]
|
|
| Improvement Status |
| Status for 2007-2008 School Year | Content Area | Met AYP Requirements | Status for 2008-2009 School Year |
| SINI Year 1 | Reading | No | SINI Year 2 |
| Acceptable | Math | No | SINI Year 1 |
| Acceptable | Other | Yes | Acceptable |
| Statewide NCLB Accountability Status |
| | READING | MATHEMATICS |
| Schools | Districts | Schools | Districts |
| N | % | N | % | N | % | N | % |
| Acceptable | 345 | 72.5 | 137 | 85.1 | 346 | 72.7 | 141 | 87.0 |
| SINI/DINI Year 1 | 58 | 12.2 | 16 | 9.9 | 63 | 13.2 | 8 | 4.9 |
| SINI/DINI Year 2 | 36 | 7.6 | 5 | 3.1 | 33 | 6.9 | 9 | 5.6 |
| Corrective Action/Level 3 | 24 | 5.0 | 3 | 1.9 | 24 | 5 | 3 | 1.9 |
| Restructure Planning/Level 4 | 13 | 2.7 | 0 | 0.0 | 10 | 2.1 | 0 | 0.0 |
| Restructuring/Level 5 | 0 | 0.0 | 0 | 0.0 | 0 | 0 | 0 | 0.0 |
| State Total | 476 | 100.0 | 161 | 100.0 | 476 | 100 | 161 | 100.0 |
|
|
Student Assessment
* indicates total number of test takers is 10 or less.
Blank indicates no science assessment test administered.
|
| NECAP Longitudinal Reports |
| 1) NECAP Teaching Year District Tested at Grade Comparison |
Reading and Math |
| 2) NECAP Teaching Year District "Cohort" History Comparison |
Reading and Math |
| 3) NECAP Teaching Year District vs. State by Tested at Grade |
Math |
Reading |
| |
| 4) NECAP Teaching Year District vs. State by "Cohort" History |
Math |
Reading |
| |
| 5) NECAP Teaching Year District GAP Analysis by Tested at Grade |
Math |
Reading |
| |
| 6) NECAP and NH ALPs Teaching Year Average Index Score and GAP analysis |
Math |
Reading |
Science |
Writing |
| 7) NECAP and NH ALPs Teaching Year Percent of students at each index level |
Math |
Reading |
Science |
Writing |
| 8) NECAP and NH ALPs Teaching Year Median Student Growth Percentile (SGP) and GAP analysis |
Math |
Reading |
| |
| 9) NECAP and NH ALPs Teaching Year Percent of students at each Student Growth Percentile (SGP) Grouping |
Math |
Reading |
| |
|
|
Student Achievement Trends
N is the number of students participating.
% is the percent of students scoring proficient or above.
Click on a grade to show the achievement trend for that grade. |
 |
| Grade | Content Area | 2009-2010 | 2010-2011 | 2011-2012 | 2012-2013 | 2013-2014 |
| N | % | N | % | N | % | N | % | N | % |
| 6 | Reading | 223 | 61 | 223 | 65 | 230 | 65 | 230 | 68 | 226 | 67 |
| Mathematics | 224 | 64 | 224 | 66 | 233 | 59 | 230 | 68 | 229 | 57 |
| 7 | Reading | 226 | 69 | 241 | 60 | 225 | 76 | 229 | 71 | 230 | 67 |
| Mathematics | 227 | 59 | 244 | 53 | 229 | 58 | 229 | 60 | 235 | 57 |
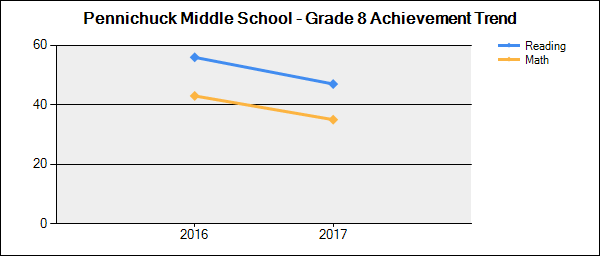
| 8 | Reading | 206 | 69 | 231 | 76 | 232 | 73 | 231 | 80 | 229 | 68 |
| Mathematics | 207 | 63 | 233 | 51 | 234 | 48 | 231 | 56 | 229 | 51 |
| Writing | 0 | | 232 | 62 | 231 | 52 | 231 | 65 | 229 | 52 |
|
|
| National Assessment of Educational Progress (NAEP) Student Achievement Data-Percent of NH Students At or Above Each Achievement Level (Based on the Winter 2007 NAEP Assessment) |
| NAEP achievement levels are indicated as follows: B+ for Basic or above, P+ for Proficient or above, and A for Advanced |
| Reading |
| Grade | B+ | P+ | A |
| 4 | 76 | 41 | 11 |
| 8 | 82 | 37 | 3 |
| Math |
| Grade | B+ | P+ | A |
| 4 | 91 | 52 | 7 |
| 8 | 78 | 38 | 8 |
|
|
|
|
|

