View State Profile
Return to Milford District
Schools
Heron Pond Elementary School
Jacques Memorial Elementary School
Milford High School
Milford Middle School
Career and Technical Education Centers
Milford HS & Applied Technology Center
|
School:Heron Pond Elementary School
|
View: State Profile
Home |
Compare |
Glossary
Select a School Year:
|
|
|
| General Information |
 |
School: Heron Pond Elementary School (27895) |
NCES School ID: 00595 |
| District: Milford (357) |
NCES District ID: 3304830 |
| SAU: Milford SAU Office (40) |
School Web Site: hp.milfordk12.org |
| Superintendent: Christi Michaud |
SAU Telephone: 603-673-2202 |
| Admin Principal: Siza Mtimbiri |
School Telephone: 603-673-1811 |
| Address: 80 Heron Pond Rd., Milford, NH 03055-3245 |
School Fax: 603-249-0010 |
| School Open Date:
8/15/2001 | School Close Date:
|
| School Type: Public School |
Grades Offered: 2-5 |
| Federal Accountability Status:
None Assigned |
NH Adequacy Status Met: Yes |
| School Report Card 2013-14 |
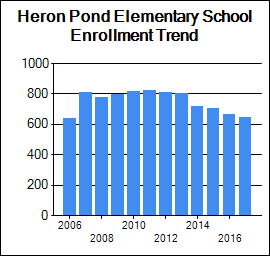
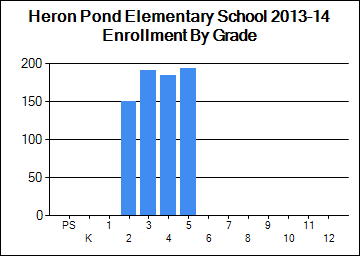
| Enrollment |
| | October 1 Enrollment | Average Class Size |
| Grade(s) | School | District | State | School | District | State |
| PreSchool | 0 | 25 | 3,401 | | | |
| Kindergarten | 0 | 128 | 11,602 | | | |
| Readiness | 0 | 0 | 58 | | | |
| Grade 1 | 0 | 192 | 13,461 | 0 | 21 | 18 |
| Grade 2 | 150 | 150 | 13,510 | 21 | 21 | 18 |
| Grade 3 | 190 | 190 | 13,546 | 24 | 24 | 19 |
| Grade 4 | 184 | 184 | 13,925 | 23 | 23 | 20 |
| Grade 5 | 193 | 193 | 13,920 | 24 | 24 | 20 |
| Grade 6 | 0 | 244 | 14,224 | 0 | 24 | 21 |
| Grade 7 | 0 | 219 | 14,328 | 0 | 0 | 22 |
| Grade 8 | 0 | 234 | 14,612 | 0 | 0 | 22 |
| Grade 9 | 0 | 192 | 15,646 | | | |
| Grade 10 | 0 | 210 | 14,953 | | | |
| Grade 11 | 0 | 192 | 14,159 | | | |
| Grade 12 | 0 | 249 | 13,962 | | | |
| Total Enrollment | 717 | 2,602 | 185,320 | | | |
|
|
| School Safety |
| | School | District | State |
| School Safety Incidences | 0 | 8 | 775 |
| Total Number of Incidents | 12 | 63 | 7,209 |
| No. of Incidents/1,000 students | 17 | 24 | 39 |
[View Safety Survey]
|
| Attendance/Four-Year Graduation Rate |
| | School | District | State |
| PreSchool Attendance Rate | | | 92.6 |
| Elem/Middle Attendance Rate (Target: 90%) | 95.6 | 95.8 | 95.5 |
| High School Four-Year Graduation Rate (Target: 90%) | | 95 | 88.7 |
[More Details]
|
|
| Teacher Quality |
| | School | District | State |
| N | % | N | % | N | % |
| Core Classes Taught by non-HQT | 0 | 0.0 | 18 | 3.0 | 2275 | 4.3 |
| Core Classes Taught by non-HQT in High-Poverty Schools | | N/A | | N/A | | 0.9 |
| Core Classes Taught by non-HQT in Low-Poverty Schools | | N/A | | N/A | | 1.4 |
| Employed Under Emergency Credentials | N/A | N/A | N/A | N/A | 1 | 0.01 |
| Bachelor's Degree | | N/C | | 33.6 | | 42.2 |
| Master's Degree | | N/C | | 63.7 | | 56.5 |
| Degree beyond Master's Degree | | N/C | | 2.2 | | 1.0 |
[More Details]
|
|
| School Staff |
| | School | District | State |
| Teachers | 49 | 183 | 14,826 |
| Instructional Support | 34 | 98 | 6,999 |
| Librarians | 1 | 3 | 312 |
| Specialists | 9 | 34 | 2,551 |
| Admin Support | 5 | 21 | 1,248 |
| All Other Support | 13 | 49 | 3,627 |
[More Details]
|
|
| State and Federal Accountability |
| Annual Measurable Objectives (AMOs) |
| Subject | Student Group | Status |
| READING | Whole School |
Category 3 | | READING | Asian |
Cell Size | | READING | Black |
Category 3 | | READING | Hispanic |
Category 3 | | READING | White |
Category 3 | | READING | Waiver - Students with Disabilities only |
Category 3 | | READING | Waiver - Economically Disadvantaged only |
Category 3 | | READING | Waiver - Students with Disabilities & Economically Disadvantaged |
Category 2 | | MATH | Whole School |
Category 2 | | MATH | Asian |
Cell Size | | MATH | Black |
Category 3 | | MATH | Hispanic |
Category 3 | | MATH | White |
Category 2 | | MATH | Waiver - Students with Disabilities only |
Category 2 | | MATH | Waiver - Economically Disadvantaged only |
Category 3 | | MATH | Waiver - Students with Disabilities & Economically Disadvantaged |
Category 1 | | Status Codes |
| Category 1 | Actual Index Score is Equal to or Greater than 2013/14 Target |
| Category 2 | Actual Index Score is Greater than previous year's score and falls within the Risk Corridor/ Confidence Interval Range |
| Category 3 | Actual Index Score is Less than previous year's score and falls within the Risk Corridor/ Confidence Interval Range |
| Category 4 | Actual Index Score is Less than previous year's score and falls below the Risk Corridor/ Confidence Interval Range |
| Cell size | Student group size is less than 11 |
| New Hampshire School Adequacy Summary |
| Met Input-Based Accountability System (IBAS): |
Yes
|
| Met Performance-Based School Accountability System (PBAS): |
Yes
|
| Performance Score: |
3.1
|
| Provides Opportunity for an Adequate Education: |
Yes
|
|
|
| Assessment Rankings |
| Ranking School Type | Subject | Nbr. of Students | Index Score and Std Error | Index Score Ranking | No. of Students Prior Year | Prior Year Index Score and Std Error | Index Score Improvement | Index Score Improvement Ranking |
|
Elem/Middle | Math | 756 | 90.4 | 113 of 362 | 764 | 90.2 | 0.2 | 95 of 360 | |
Elem/Middle | Read | 756 | 91.1 | 213 of 362 | 764 | 92.4 | -1.3 | 220 of 360 | |
Elem/Middle | Write | 183 | 84.2 | 200 of 320 | 207 | 88.2 | -4 | 236 of 316 |
|
|
Student Assessment
* indicates total number of test takers is 10 or less.
Blank indicates no science assessment test administered.
|
| Achievement Level (%) | Reading | Mathematics | Writing | Science |
| School | District | State | School | District | State | School | District | State | School | District | State |
| Substantially Below Proficient (%) | 7 | 6 | 7 | 8 | 12 | 17 | 9 | 6 | 8 | 8 | 16 | 18 |
| Partially Proficient (%) | 18 | 14 | 16 | 15 | 17 | 18 | 34 | 37 | 34 | 37 | 48 | 48 |
| Proficient (%) | 53 | 55 | 53 | 49 | 46 | 43 | 44 | 49 | 47 | 53 | 35 | 32 |
| Proficient with Distinction (%) | 22 | 24 | 23 | 27 | 25 | 21 | 13 | 8 | 9 | 1 | 1 | 1 |
| Testing Participation (%) | 100 | 100 | 99 | 100 | 99 | 99 | 99 | 99 | 98 | 99 | 100 | 99 |
| NECAP Longitudinal Reports |
| 1) NECAP Teaching Year District Tested at Grade Comparison |
Reading and Math |
| 2) NECAP Teaching Year District "Cohort" History Comparison |
Reading and Math |
| 3) NECAP Teaching Year District vs. State by Tested at Grade |
Math |
Reading |
| |
| 4) NECAP Teaching Year District vs. State by "Cohort" History |
Math |
Reading |
| |
| 5) NECAP Teaching Year District GAP Analysis by Tested at Grade |
Math |
Reading |
| |
| 6) NECAP and NH ALPs Teaching Year Average Index Score and GAP analysis |
Math |
Reading |
Science |
Writing |
| 7) NECAP and NH ALPs Teaching Year Percent of students at each index level |
Math |
Reading |
Science |
Writing |
| 8) NECAP and NH ALPs Teaching Year Median Student Growth Percentile (SGP) and GAP analysis |
Math |
Reading |
| |
| 9) NECAP and NH ALPs Teaching Year Percent of students at each Student Growth Percentile (SGP) Grouping |
Math |
Reading |
| |
|
|
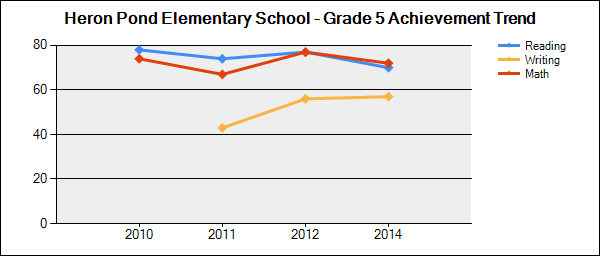
Student Achievement Trends
N is the number of students participating.
% is the percent of students scoring proficient or above.
Click on a grade to show the achievement trend for that grade. |
 |
| Grade | Content Area | 2009-2010 | 2010-2011 | 2011-2012 | 2012-2013 | 2013-2014 |
| N | % | N | % | N | % | N | % | N | % |
| 3 | Reading | 206 | 83 | 208 | 83 | 194 | 78 | 182 | 77 | 190 | 75 |
| Mathematics | 209 | 78 | 208 | 73 | 194 | 74 | 182 | 75 | 190 | 77 |
| 4 | Reading | 219 | 74 | 209 | 72 | 218 | 78 | 196 | 79 | 184 | 79 |
| Mathematics | 220 | 67 | 209 | 66 | 218 | 80 | 196 | 76 | 185 | 81 |
| 5 | Reading | 180 | 78 | 218 | 74 | 209 | 77 | 228 | 77 | 192 | 70 |
| Mathematics | 180 | 74 | 218 | 67 | 209 | 77 | 228 | 82 | 192 | 72 |
| Writing | 0 | | 218 | 43 | 209 | 56 | 228 | 66 | 192 | 57 |
|
|
| National Assessment of Educational Progress (NAEP) Student Achievement Data-Percent of NH Students At or Above Each Achievement Level (Based on the Winter 2013 NAEP Assessment) |
| NAEP achievement levels are indicated as follows: B+ for Basic or above, P+ for Proficient or above, and A for Advanced |
| Reading |
| Grade | B+ | P+ | A |
| 4 | 80 | 45 | 11 |
| 8 | 84 | 44 | 6 |
| Math |
| Grade | B+ | P+ | A |
| 4 | 93 | 59 | 12 |
| 8 | 84 | 47 | 13 |
|
|
|
|
|

