View State Profile
Return to Derry Cooperative District
Schools
Derry Village School
East Derry Memorial Elementary School
Ernest P. Barka Elementary School
Gilbert H. Hood Middle School
Grinnell School
South Range Elementary School
West Running Brook Middle School
|
School:Gilbert H. Hood Middle School
|
View: State Profile
Home |
Compare |
Glossary
Select a School Year:
|
|
|
| General Information |
 |
School: Gilbert H. Hood Middle School (20420) |
NCES School ID: 00086 |
| District: Derry Cooperative (131) |
NCES District ID: 3302610 |
| SAU: Derry Cooperative SAU Office (10) |
School Web Site: ghh.sau10.org |
| Superintendent: Austin Garofalo |
SAU Telephone: 603-432-1210 |
| Admin Principal: Kim Carpentino |
School Telephone: 603-432-1224 |
| Address: 5 Hood Rd., Derry, NH 03038-2099 |
School Fax: 603-432-1227 |
| School Open Date:
| School Close Date:
|
| School Type: Public School |
Grades Offered: 6-8 |
| Federal Accountability Status:
None Assigned |
NH Adequacy Status Met: Yes |
| School Report Card 2013-14 |
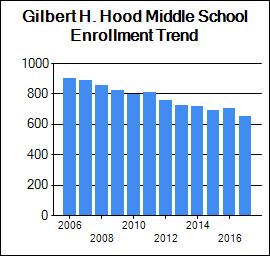
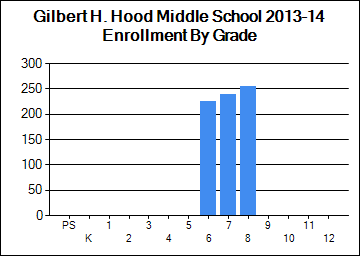
| Enrollment |
| | October 1 Enrollment | Average Class Size |
| Grade(s) | School | District | State | School | District | State |
| PreSchool | 0 | 61 | 3,401 | | | |
| Kindergarten | 0 | 302 | 11,602 | | | |
| Readiness | 0 | 0 | 58 | | | |
| Grade 1 | 0 | 384 | 13,461 | 0 | 17 | 18 |
| Grade 2 | 0 | 371 | 13,510 | 0 | 17 | 18 |
| Grade 3 | 0 | 362 | 13,546 | 0 | 20 | 19 |
| Grade 4 | 0 | 387 | 13,925 | 0 | 20 | 20 |
| Grade 5 | 0 | 387 | 13,920 | 0 | 22 | 20 |
| Grade 6 | 225 | 416 | 14,224 | 0 | 0 | 21 |
| Grade 7 | 239 | 418 | 14,328 | 0 | 0 | 22 |
| Grade 8 | 255 | 455 | 14,612 | 0 | 0 | 22 |
| Grade 9 | 0 | 0 | 15,646 | | | |
| Grade 10 | 0 | 0 | 14,953 | | | |
| Grade 11 | 0 | 0 | 14,159 | | | |
| Grade 12 | 0 | 0 | 13,962 | | | |
| Total Enrollment | 719 | 3,543 | 185,320 | | | |
|
|
| School Safety |
| | School | District | State |
| School Safety Incidences | 10 | 14 | 775 |
| Total Number of Incidents | 73 | 210 | 7,209 |
| No. of Incidents/1,000 students | 102 | 59 | 39 |
[View Safety Survey]
|
| Attendance/Four-Year Graduation Rate |
| | School | District | State |
| PreSchool Attendance Rate | | | 92.6 |
| Elem/Middle Attendance Rate (Target: 90%) | 95.3 | 95.6 | 95.5 |
| High School Four-Year Graduation Rate (Target: 90%) | | | 88.7 |
[More Details]
|
|
| Teacher Quality |
| | School | District | State |
| N | % | N | % | N | % |
| Core Classes Taught by non-HQT | 13 | 5.1 | 37 | 4.2 | 2275 | 4.3 |
| Core Classes Taught by non-HQT in High-Poverty Schools | | N/A | | 0.0 | | 0.9 |
| Core Classes Taught by non-HQT in Low-Poverty Schools | | N/A | | 0.3 | | 1.4 |
| Employed Under Emergency Credentials | N/A | N/A | N/A | N/A | 1 | 0.01 |
| Bachelor's Degree | | N/C | | 30.7 | | 42.2 |
| Master's Degree | | N/C | | 69.3 | | 56.5 |
| Degree beyond Master's Degree | | N/C | | 0.0 | | 1.0 |
[More Details]
|
|
| School Staff |
| | School | District | State |
| Teachers | 52 | 264 | 14,826 |
| Instructional Support | 16 | 139 | 6,999 |
| Librarians | 0 | 3 | 312 |
| Specialists | 6 | 51 | 2,551 |
| Admin Support | 3 | 15 | 1,248 |
| All Other Support | 16 | 70 | 3,627 |
[More Details]
|
|
| State and Federal Accountability |
| Annual Measurable Objectives (AMOs) |
| Subject | Student Group | Status |
| READING | Whole School |
Category 3 | | READING | Hispanic |
Category 3 | | READING | White |
Category 3 | | READING | Waiver - Students with Disabilities only |
Category 3 | | READING | Waiver - Economically Disadvantaged only |
Category 2 | | READING | Waiver - Students with Disabilities & Economically Disadvantaged |
Category 3 | | MATH | Whole School |
Category 3 | | MATH | Hispanic |
Category 3 | | MATH | White |
Category 3 | | MATH | Waiver - Students with Disabilities only |
Category 3 | | MATH | Waiver - Economically Disadvantaged only |
Category 3 | | MATH | Waiver - Students with Disabilities & Economically Disadvantaged |
Category 3 | | Status Codes |
| Category 1 | Actual Index Score is Equal to or Greater than 2013/14 Target |
| Category 2 | Actual Index Score is Greater than previous year's score and falls within the Risk Corridor/ Confidence Interval Range |
| Category 3 | Actual Index Score is Less than previous year's score and falls within the Risk Corridor/ Confidence Interval Range |
| Category 4 | Actual Index Score is Less than previous year's score and falls below the Risk Corridor/ Confidence Interval Range |
| Cell size | Student group size is less than 11 |
| New Hampshire School Adequacy Summary |
| Met Input-Based Accountability System (IBAS): |
Yes
|
| Met Performance-Based School Accountability System (PBAS): |
No
|
| Performance Score: |
2.1
|
| Provides Opportunity for an Adequate Education: |
Yes
|
|
|
| Assessment Rankings |
| Ranking School Type | Subject | Nbr. of Students | Index Score and Std Error | Index Score Ranking | No. of Students Prior Year | Prior Year Index Score and Std Error | Index Score Improvement | Index Score Improvement Ranking |
|
Elem/Middle | Math | 452 | 77.8 | 327 of 362 | 468 | 80.9 | -3.1 | 274 of 360 | |
Elem/Middle | Read | 452 | 88.8 | 269 of 362 | 468 | 90.1 | -1.3 | 216 of 360 | |
Elem/Middle | Write | 232 | 82.8 | 223 of 320 | 235 | 86.6 | -3.8 | 233 of 316 |
|
|
Student Assessment
* indicates total number of test takers is 10 or less.
Blank indicates no science assessment test administered.
|
| Achievement Level (%) | Reading | Mathematics | Writing | Science |
| School | District | State | School | District | State | School | District | State | School | District | State |
| Substantially Below Proficient (%) | 9 | 9 | 7 | 21 | 15 | 17 | 11 | 11 | 8 | 25 | 15 | 18 |
| Partially Proficient (%) | 20 | 18 | 16 | 21 | 19 | 18 | 35 | 30 | 34 | 58 | 50 | 48 |
| Proficient (%) | 56 | 56 | 53 | 42 | 46 | 43 | 49 | 51 | 47 | 15 | 34 | 32 |
| Proficient with Distinction (%) | 15 | 17 | 23 | 15 | 21 | 21 | 4 | 8 | 9 | 0 | 1 | 1 |
| Testing Participation (%) | 100 | 100 | 99 | 100 | 100 | 99 | 100 | 100 | 98 | 99 | 100 | 99 |
| NECAP Longitudinal Reports |
| 1) NECAP Teaching Year District Tested at Grade Comparison |
Reading and Math |
| 2) NECAP Teaching Year District "Cohort" History Comparison |
Reading and Math |
| 3) NECAP Teaching Year District vs. State by Tested at Grade |
Math |
Reading |
| |
| 4) NECAP Teaching Year District vs. State by "Cohort" History |
Math |
Reading |
| |
| 5) NECAP Teaching Year District GAP Analysis by Tested at Grade |
Math |
Reading |
| |
| 6) NECAP and NH ALPs Teaching Year Average Index Score and GAP analysis |
Math |
Reading |
Science |
Writing |
| 7) NECAP and NH ALPs Teaching Year Percent of students at each index level |
Math |
Reading |
Science |
Writing |
| 8) NECAP and NH ALPs Teaching Year Median Student Growth Percentile (SGP) and GAP analysis |
Math |
Reading |
| |
| 9) NECAP and NH ALPs Teaching Year Percent of students at each Student Growth Percentile (SGP) Grouping |
Math |
Reading |
| |
|
|
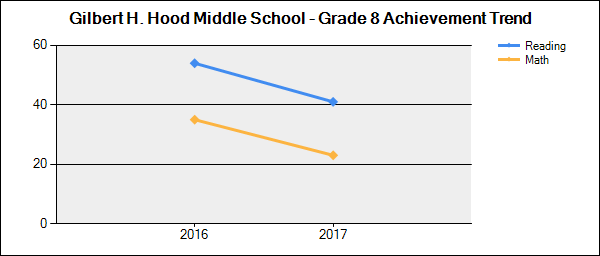
Student Achievement Trends
N is the number of students participating.
% is the percent of students scoring proficient or above.
Click on a grade to show the achievement trend for that grade. |
 |
| Grade | Content Area | 2009-2010 | 2010-2011 | 2011-2012 | 2012-2013 | 2013-2014 |
| N | % | N | % | N | % | N | % | N | % |
| 6 | Reading | 254 | 75 | 257 | 78 | 239 | 72 | 225 | 80 | 224 | 73 |
| Mathematics | 254 | 76 | 258 | 71 | 239 | 67 | 225 | 70 | 224 | 69 |
| 7 | Reading | 283 | 73 | 266 | 73 | 249 | 76 | 239 | 66 | 240 | 72 |
| Mathematics | 283 | 70 | 266 | 65 | 249 | 68 | 240 | 55 | 240 | 59 |
| 8 | Reading | 257 | 70 | 282 | 76 | 263 | 85 | 251 | 76 | 254 | 69 |
| Mathematics | 257 | 57 | 284 | 62 | 264 | 63 | 254 | 61 | 255 | 47 |
| Writing | 0 | | 282 | 60 | 263 | 57 | 251 | 62 | 254 | 54 |
|
|
| National Assessment of Educational Progress (NAEP) Student Achievement Data-Percent of NH Students At or Above Each Achievement Level (Based on the Winter 2013 NAEP Assessment) |
| NAEP achievement levels are indicated as follows: B+ for Basic or above, P+ for Proficient or above, and A for Advanced |
| Reading |
| Grade | B+ | P+ | A |
| 4 | 80 | 45 | 11 |
| 8 | 84 | 44 | 6 |
| Math |
| Grade | B+ | P+ | A |
| 4 | 93 | 59 | 12 |
| 8 | 84 | 47 | 13 |
|
|
|
|
|

