View State Profile
Return to Salem District
Schools
Dr. L. F. Soule School
Mary A. Fisk Elementary School
North Salem Elementary School
Salem High School
Walter F. Haigh School
William E. Lancaster School
William T. Barron Elementary School
Woodbury School
Career and Technical Education Centers
Salem Career & Technical Education Ctr
|
School:William T. Barron Elementary School
|
View: State Profile
Home |
Compare |
Glossary
Select a School Year:
|
|
|
| General Information |
 |
School: William T. Barron Elementary School (22865) |
NCES School ID: 00400 |
| District: Salem (473) |
NCES District ID: 3306060 |
| SAU: Salem SAU Office (57) |
School Web Site: www.sau57.org/barron |
| Superintendent: Maura Palmer |
SAU Telephone: 603-893-7040 |
| Admin Principal: Marie Alsup |
School Telephone: 603-893-7067 |
| Address: 55 Butler St., Salem, NH 03079-3968 |
School Fax: 603-893-7068 |
| School Open Date:
| School Close Date:
|
| School Type: Public School |
Grades Offered: K 1-5 |
| Federal Accountability Status Met:
Yes |
NH Accountability Status Met: Yes |
| School Report Card 2011-12 |
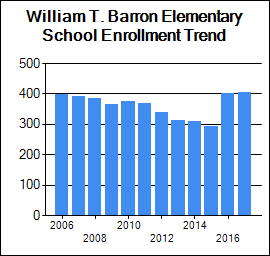
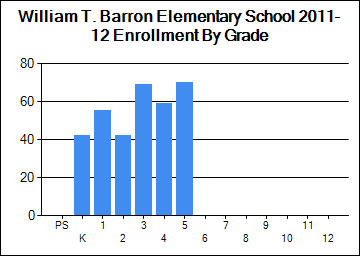
| Enrollment |
| | October 1 Enrollment | Average Class Size |
| Grade(s) | School | District | State | School | District | State |
| PreSchool | 0 | 39 | 3,165 | | | |
| Kindergarten | 42 | 219 | 11,904 | | | |
| Readiness | 0 | 0 | 78 | | | |
| Grade 1 | 55 | 286 | 13,595 | 18 | 18 | 18 |
| Grade 2 | 42 | 290 | 13,845 | 14 | 17 | 18 |
| Grade 3 | 69 | 317 | 13,876 | 23 | 20 | 19 |
| Grade 4 | 59 | 307 | 14,167 | 20 | 20 | 20 |
| Grade 5 | 70 | 314 | 14,200 | 23 | 21 | 20 |
| Grade 6 | 0 | 328 | 14,568 | 0 | 16 | 21 |
| Grade 7 | 0 | 353 | 14,811 | 0 | 18 | 21 |
| Grade 8 | 0 | 369 | 15,102 | 0 | 18 | 22 |
| Grade 9 | 0 | 395 | 16,465 | | | |
| Grade 10 | 0 | 390 | 15,350 | | | |
| Grade 11 | 0 | 331 | 14,985 | | | |
| Grade 12 | 0 | 382 | 14,673 | | | |
| Total Enrollment | 337 | 4,320 | 190,805 | | | |
|
|
| School Safety |
| | School | District | State |
| School Safety Incidences | 0 | 4 | 1,505 |
| Total Number of Incidents | 2 | 80 | 23,633 |
| No. of Incidents/1,000 students | 6 | 19 | 124 |
[View Safety Survey]
|
| Attendance/Four-Year Graduation Rate |
| | School | District | State |
| PreSchool Attendance Rate | | | 92 |
| Elem/Middle Attendance Rate (Target: 90%) | 96.1 | 95.5 | 95.5 |
| High School Four-Year Graduation Rate (Target: 85%) | | 94.9 | 86.6 |
[More Details]
|
|
| Teacher Quality |
| | School | District | State |
| N | % | N | % | N | % |
| Core Classes Taught by non-HQT | 0 | 0.0 | 7 | 0.8 | 3276 | 5.9 |
| Core Classes Taught by non-HQT in High-Poverty Schools | | N/A | | N/A | | 1.2 |
| Core Classes Taught by non-HQT in Low-Poverty Schools | | 0.0 | | 0.7 | | 1.5 |
| Employed Under Emergency Credentials | N/A | N/A | N/A | N/A | 5 | 0.04 |
| Bachelor's Degree | | N/C | | 38.4 | | 39.5 |
| Master's Degree | | N/C | | 55.9 | | 47.7 |
| Degree beyond Master's Degree | | N/C | | 0.3 | | 0.8 |
[More Details]
|
|
| School Staff |
| | School | District | State |
| Teachers | 22 | 318 | 15,049 |
| Instructional Support | 10 | 157 | 6,964 |
| Librarians | 0 | 3 | 313 |
| Specialists | 4 | 61 | 2,550 |
| Admin Support | 1 | 21 | 1,245 |
| All Other Support | 8 | 90 | 3,598 |
[More Details]
|
|
| Improvement Status |
| Status for 2011-2012 School Year | Content Area | Met AYP Requirements | Status for 2012-2013 School Year |
| SINI Year 1 | Reading | Yes | SINI Year 1 |
| SINI Year 1 | Math | Yes | SINI Year 1 |
| Acceptable | Other | Yes | Acceptable |
| Statewide NCLB Accountability Status |
| | READING | MATHEMATICS |
| Schools | Districts | Schools | Districts |
| N | % | N | % | N | % | N | % |
| Acceptable | 279 | 60.5 | 105 | 65.6 | 241 | 52.3 | 82 | 51.6 |
| SINI/DINI Year 1 | 41 | 8.9 | 24 | 15.0 | 67 | 14.5 | 26 | 16.4 |
| SINI/DINI Year2 | 57 | 12.4 | 13 | 8.1 | 71 | 15.4 | 26 | 16.4 |
| Corrective Action/Level 3 | 37 | 8.0 | 13 | 8.1 | 34 | 7.4 | 11 | 6.9 |
| Restructure Planning/Level 4 | 23 | 5.0 | 3 | 1.9 | 27 | 5.9 | 9 | 5.7 |
| Restructuring/Level 5&6 | 24 | 5.2 | 2 | 1.3 | 21 | 4.6 | 5 | 3.1 |
| State Total | 461 | 100.0 | 160 | 100.0 | 461 | 100 | 159 | 100.0 |
| New Hampshire School Adequacy Summary |
| Met Input-Based Accountability System (IBAS): |
No
|
| Met Performance-Based School Accountability System (PBAS): |
Yes
|
| Performance Score: |
2.9
|
| Provides Opportunity for an Adequate Education: |
Yes
|
|
|
| Assessment Rankings |
| Ranking School Type | Subject | Nbr. of Students | Index Score and Std Error | Index Score Ranking | No. of Students Prior Year | Prior Year Index Score and Std Error | Index Score Improvement | Index Score Improvement Ranking |
|
Elem/Middle | Math | 273 | 93.8 (+/-0.9) | 57 of 369 | 263 | 93.5 (+/-1) | 0.3 | 152 of 366 | |
Elem/Middle | Read | 273 | 95.3 (+/-0.7) | 89 of 369 | 264 | 93.8 (+/-0.9) | 1.5 | 90 of 366 | |
Elem/Middle | Write | 71 | 88.2 (+/-1.7) | 124 of 325 | 72 | 89.4 (+/-1.8) | -1.2 | 167 of 319 |
|
|
Student Assessment
* indicates total number of test takers is 10 or less.
Blank indicates no science assessment test administered.
|
| Achievement Level (%) | Reading | Mathematics | Writing | Science |
| School | District | State | School | District | State | School | District | State | School | District | State |
| Substantially Below Proficient (%) | 1 | 5 | 7 | 3 | 13 | 16 | 0 | 5 | 8 | 7 | 11 | 17 |
| Partially Proficient (%) | 16 | 14 | 15 | 12 | 15 | 17 | 43 | 40 | 37 | 47 | 49 | 43 |
| Proficient (%) | 54 | 56 | 54 | 52 | 47 | 43 | 50 | 48 | 45 | 47 | 38 | 37 |
| Proficient with Distinction (%) | 29 | 24 | 24 | 34 | 24 | 23 | 7 | 6 | 8 | 0 | 1 | 1 |
| Testing Participation (%) | 100 | 99 | 99 | 100 | 99 | 99 | 100 | 99 | 99 | 100 | 100 | 99 |
| For assessment rankings click on this link: | [Ranking Reports] |
| NECAP Longitudinal Reports |
| 1) NECAP Teaching Year District Tested at Grade Comparison |
Reading and Math |
| 2) NECAP Teaching Year District "Cohort" History Comparison |
Reading and Math |
| 3) NECAP Teaching Year District vs. State by Tested at Grade |
Math |
Reading |
| |
| 4) NECAP Teaching Year District vs. State by "Cohort" History |
Math |
Reading |
| |
| 5) NECAP Teaching Year District GAP Analysis by Tested at Grade |
Math |
Reading |
| |
| 6) NECAP and NH ALPs Teaching Year Average Index Score and GAP analysis |
Math |
Reading |
Science |
Writing |
| 7) NECAP and NH ALPs Teaching Year Percent of students at each index level |
Math |
Reading |
Science |
Writing |
| 8) NECAP and NH ALPs Teaching Year Median Student Growth Percentile (SGP) and GAP analysis |
Math |
Reading |
| |
| 9) NECAP and NH ALPs Teaching Year Percent of students at each Student Growth Percentile (SGP) Grouping |
Math |
Reading |
| |
|
|
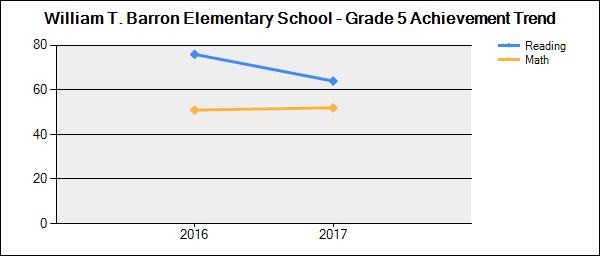
Student Achievement Trends
N is the number of students participating.
% is the percent of students scoring proficient or above.
Click on a grade to show the achievement trend for that grade. |
 |
| Grade | Content Area | 2009-2010 | 2010-2011 | 2011-2012 | 2012-2013 | 2013-2014 |
| N | % | N | % | N | % | N | % | N | % |
| 3 | Reading | 68 | 87 | 57 | 82 | 69 | 86 | 37 | 89 | 53 | 87 |
| Mathematics | 68 | 96 | 58 | 90 | 69 | 87 | 37 | 95 | 53 | 89 |
| 4 | Reading | 76 | 83 | 74 | 84 | 58 | 84 | 67 | 85 | 40 | 88 |
| Mathematics | 76 | 84 | 73 | 81 | 58 | 81 | 67 | 82 | 39 | 90 |
| 5 | Reading | 69 | 87 | 77 | 88 | 70 | 80 | 63 | 86 | 70 | 81 |
| Mathematics | 69 | 87 | 77 | 82 | 70 | 89 | 63 | 87 | 70 | 81 |
| Writing | 0 | | 77 | 60 | 70 | 57 | 63 | 65 | 70 | 74 |
|
|
| National Assessment of Educational Progress (NAEP) Student Achievement Data-Percent of NH Students At or Above Each Achievement Level (Based on the Winter 2011 NAEP Assessment) |
| NAEP achievement levels are indicated as follows: B+ for Basic or above, P+ for Proficient or above, and A for Advanced |
| Reading |
| Grade | B+ | P+ | A |
| 4 | 78 | 43 | 10 |
| 8 | 84 | 40 | 4 |
| Math |
| Grade | B+ | P+ | A |
| 4 | 92 | 57 | 11 |
| 8 | 82 | 44 | 11 |
|
|
|
|
|

